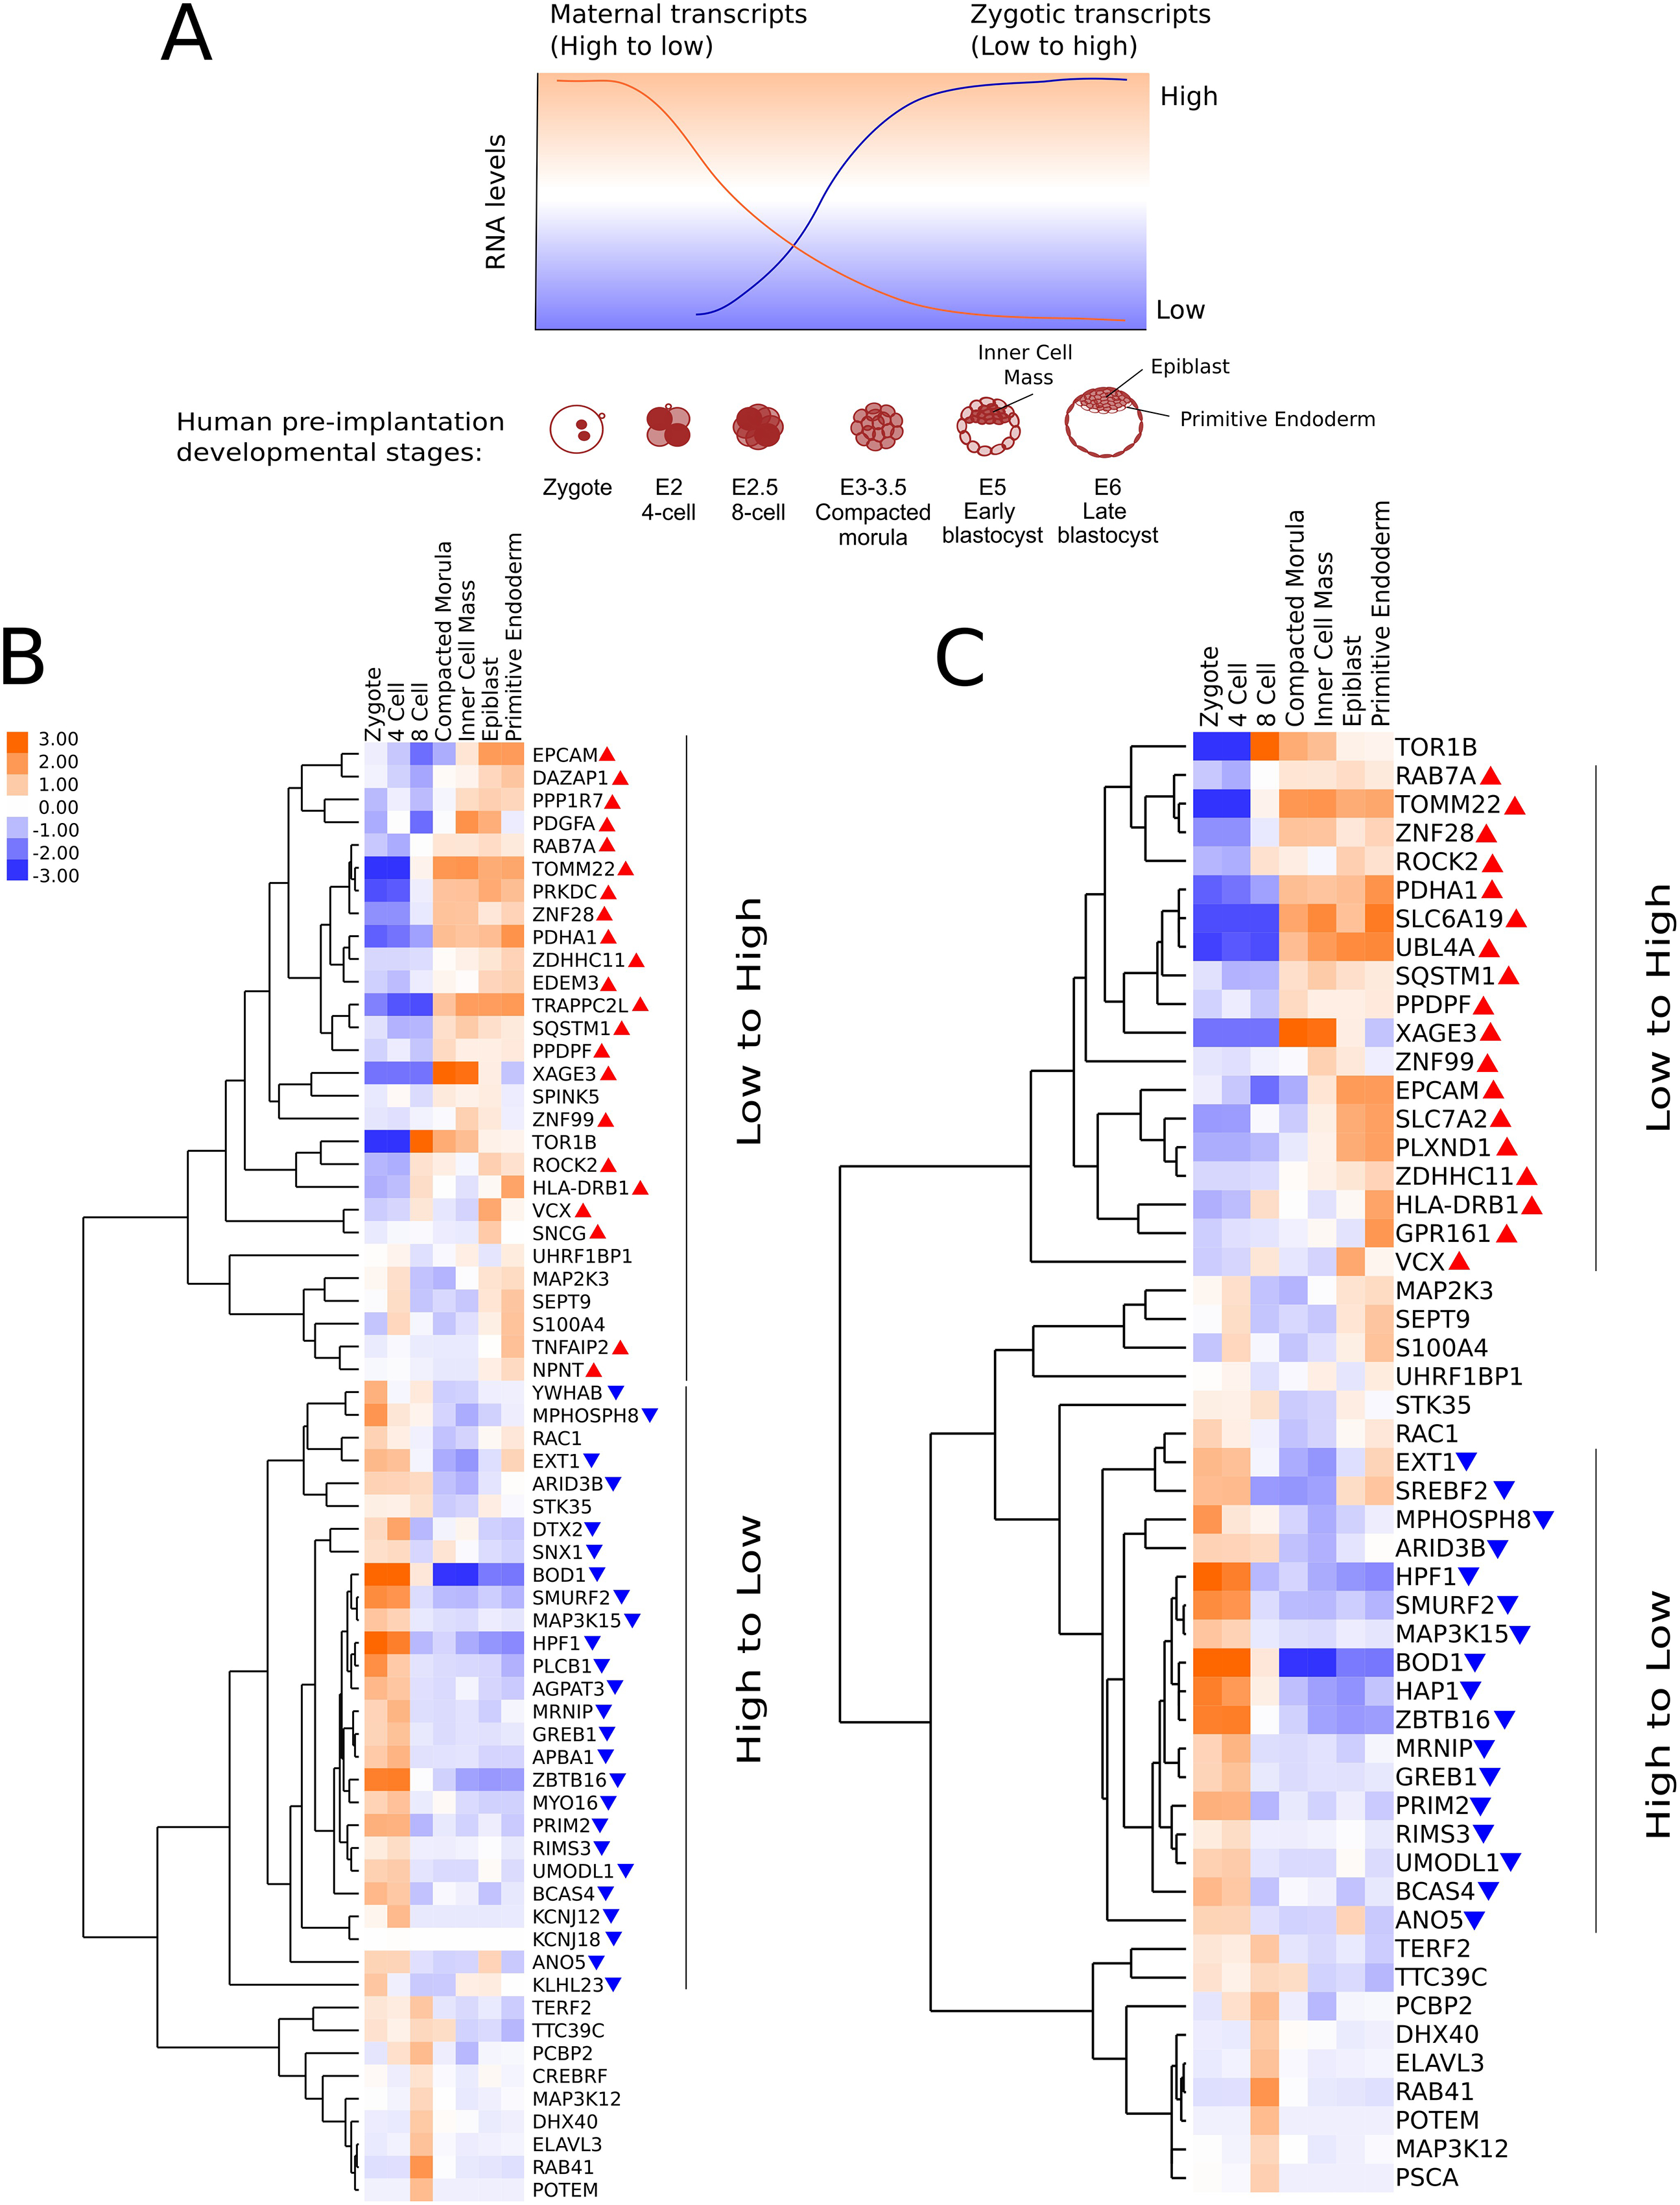
Figure 3. Genes enriched for 3’UTR variants within miRNA binding sites follow expression resembling maternal transcript clearance pattern.

(A) A schematic diagram of anticipated mRNA changes during early stages of human embryogenesis. The human preimplantation developmental stages are labeled on the x-axis, and the presumed RNA time courses for maternal (orange) and zygotic (blue) transcripts are indicated with solid lines. (B) Clustering of 64 genes with significant 3’UTR variants in the single variant analysis of patient vs control groups. (C) Clustering of 51 Genes with significant 3’UTR variants from the burden analysis of patient versus control groups. Gene expressions were log2(FPKM+1) transformed and mean-centered row-wise. Color scales are the same for B and C. Genes following a “low-to-high” expression pattern are indicated with red upwards triangles. Genes following a “high-to-low” expression pattern are indicated with blue downwards triangles (see Methods). Dendrograms were generated by hierarchical clustering of the transformed expression data. Developmental stages: zygote, 4 cell, 8 cell, compacted morula, early blastocyst (Inner Cell Mass), and late blastocyst (Epiblast and Primitive Endoderm).
