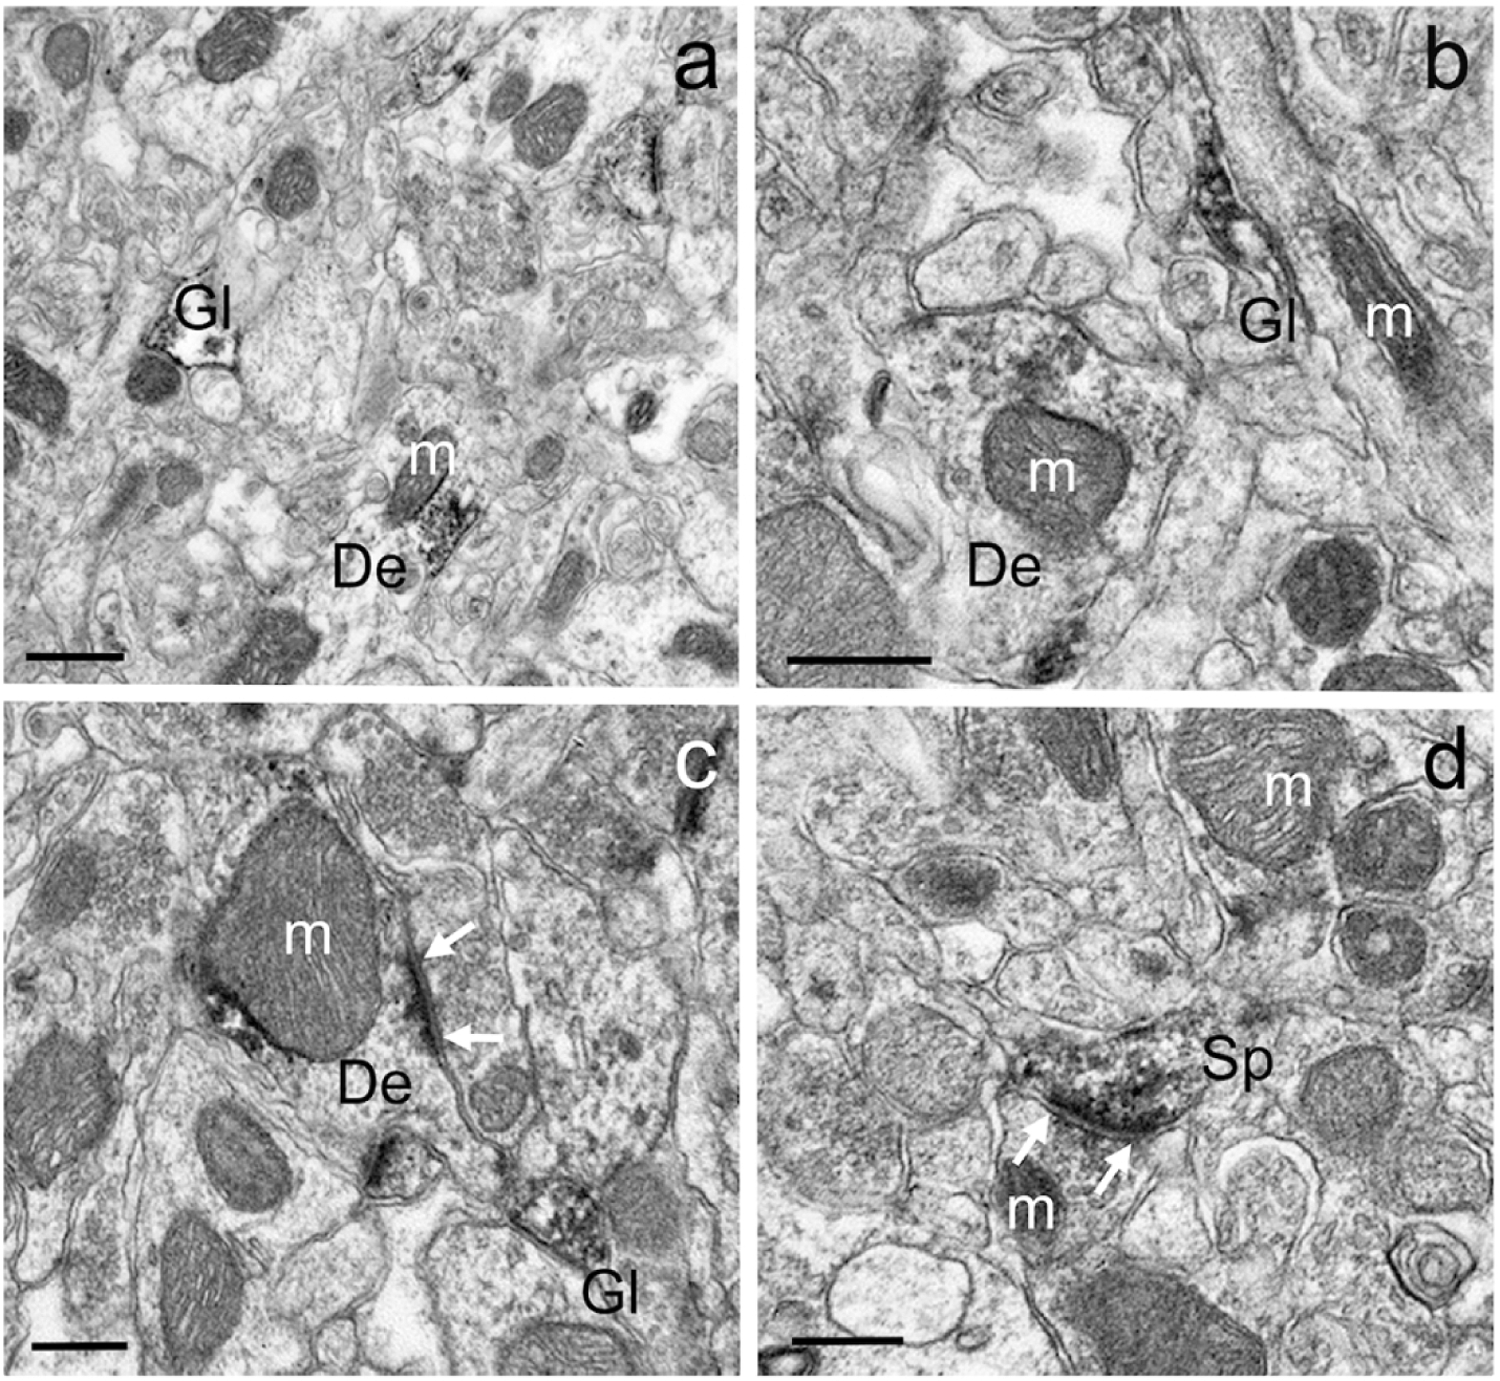
Figure 2: GluD1-immunoreactive elements in the mouse striatum.

Examples of different GluD1-immunoreactive dendrites (a-c), spines (d) and glia (a,b) in the mouse dorsal striatum. In c and d, white arrows indicate asymmetric axo-dendritic (c) and axo-spinous (d) synapses. Note some GluD1 peroxidase staining associated with the surface of mitochondria in a-c. Abbreviations: Sp: spine, De: dendrite, Gl: glia and m: mitochondria. Scale bar in a = 0.50μm. Scale bar in b = 0.35μm. Scale bar in c = 0.25μm. Scale bar in d = 0.25μm.
