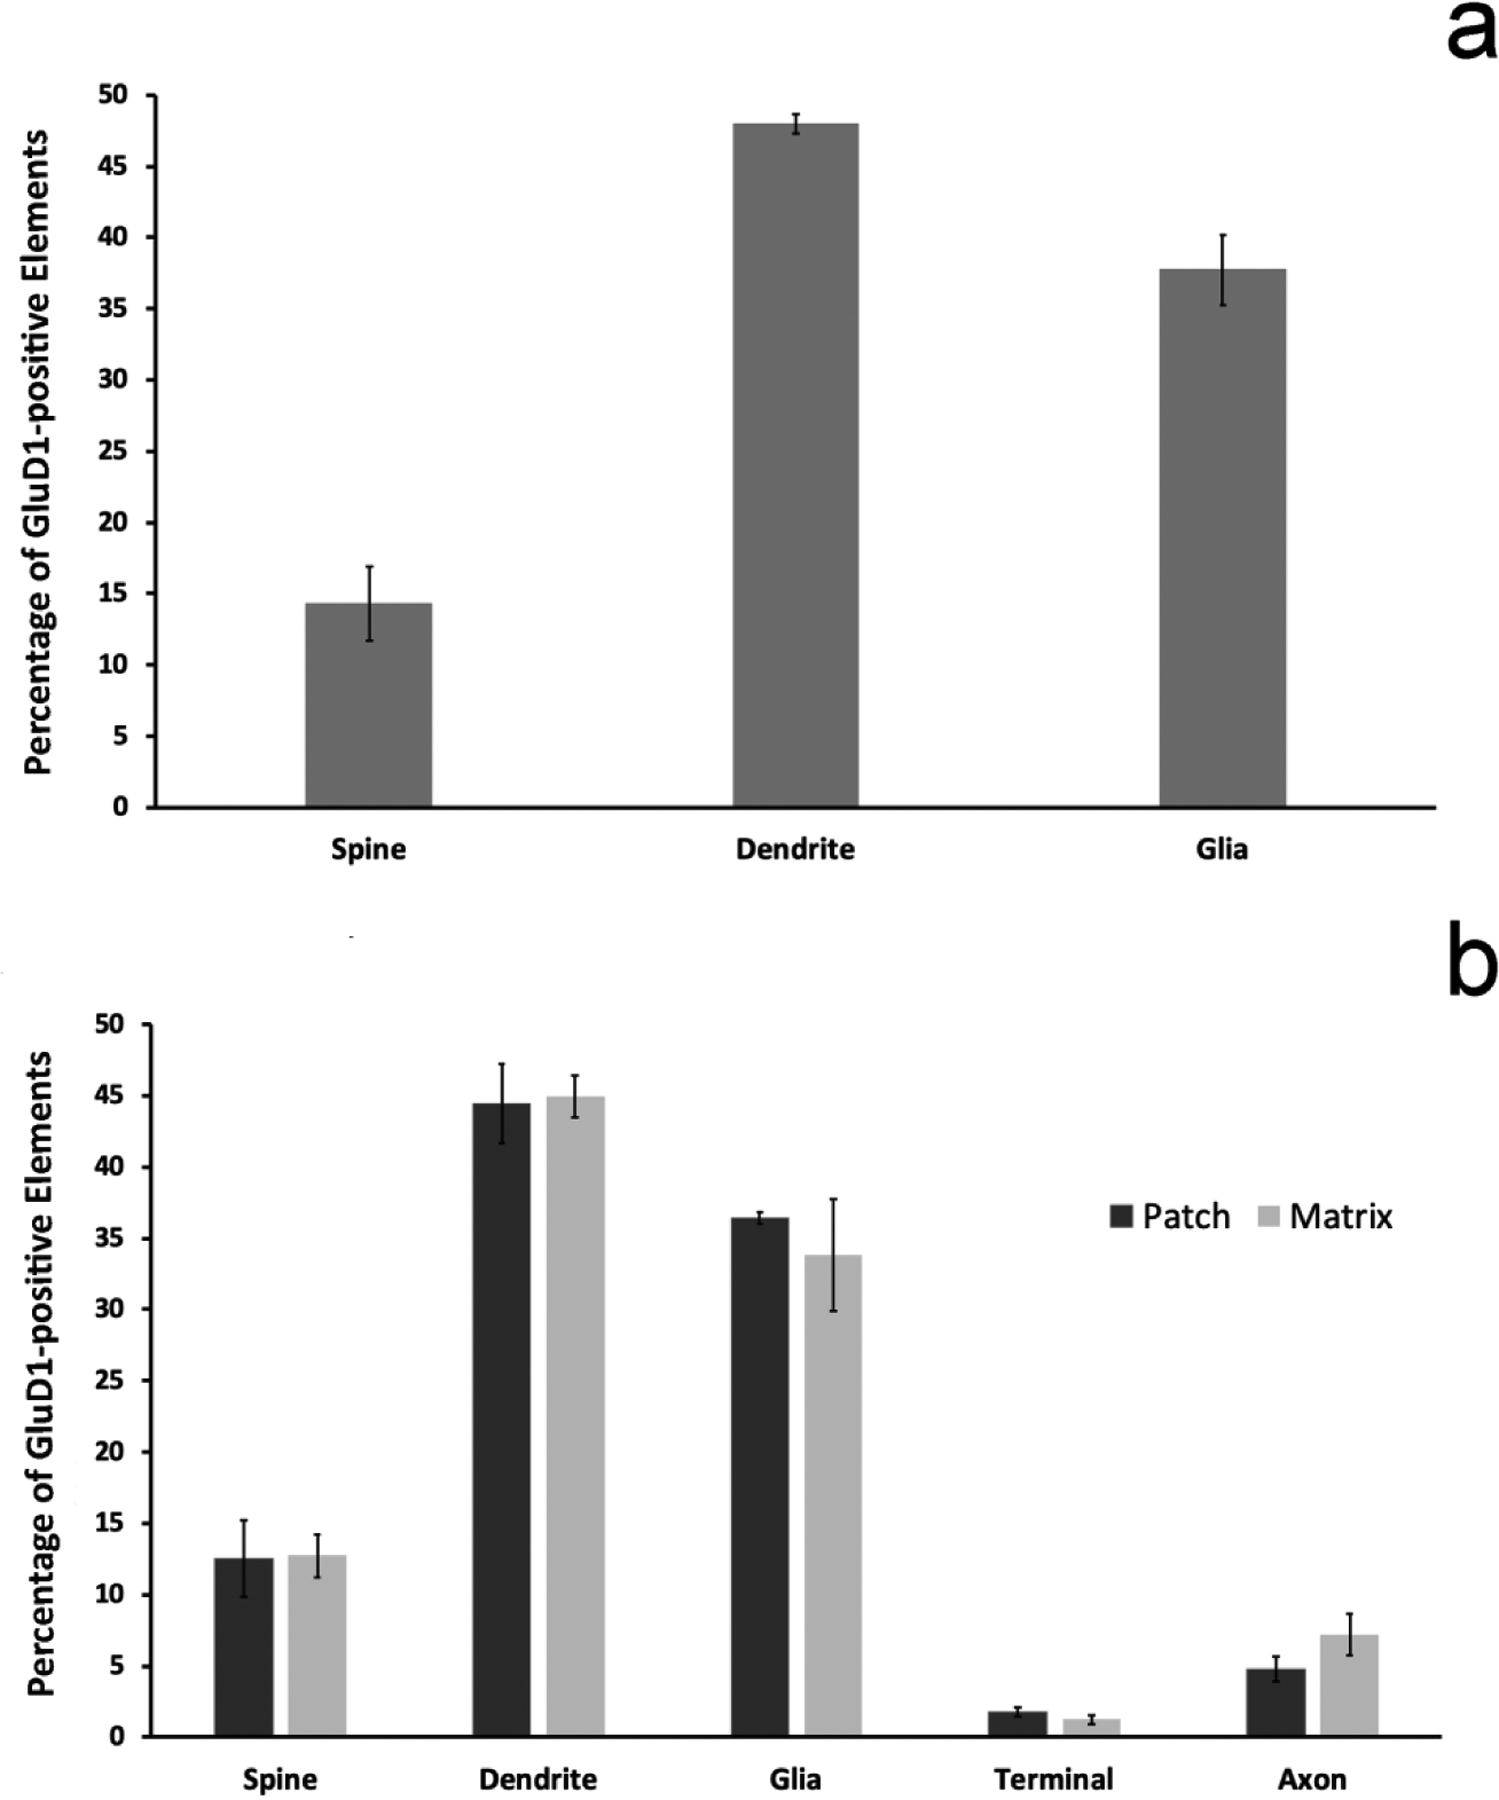
Figure 4: Relative Distribution of GluD1-immunostained elements.

(a) shows the mean relative percentages (+/− SEM) of GluD1-positive neuronal and glial structures in the matrix compartment of the mouse dorsal striatum (N=3 animals; n=157 images). (b) illustrates the relative percentage of GluD1-immunostained elements in the striosome vs matrix compartments of the monkey caudate nucleus (N=3 animals; n=324 images). There is no statistically significant difference in the relative percentages of the different neuronal and glial elements between the striosome and matrix compartments (two sample t-test; dendrites p=0.870; glia p=0.548; spines p=0.953; axons p=0.243; terminals p=0.268). There is also no statistically significant difference between the percentages of GluD1-immunoreactive elements of the mouse vs the monkey matrix compartment (two-sample t-test; dendrites p=0.140; glia p=0.451; spines p=0.633).
