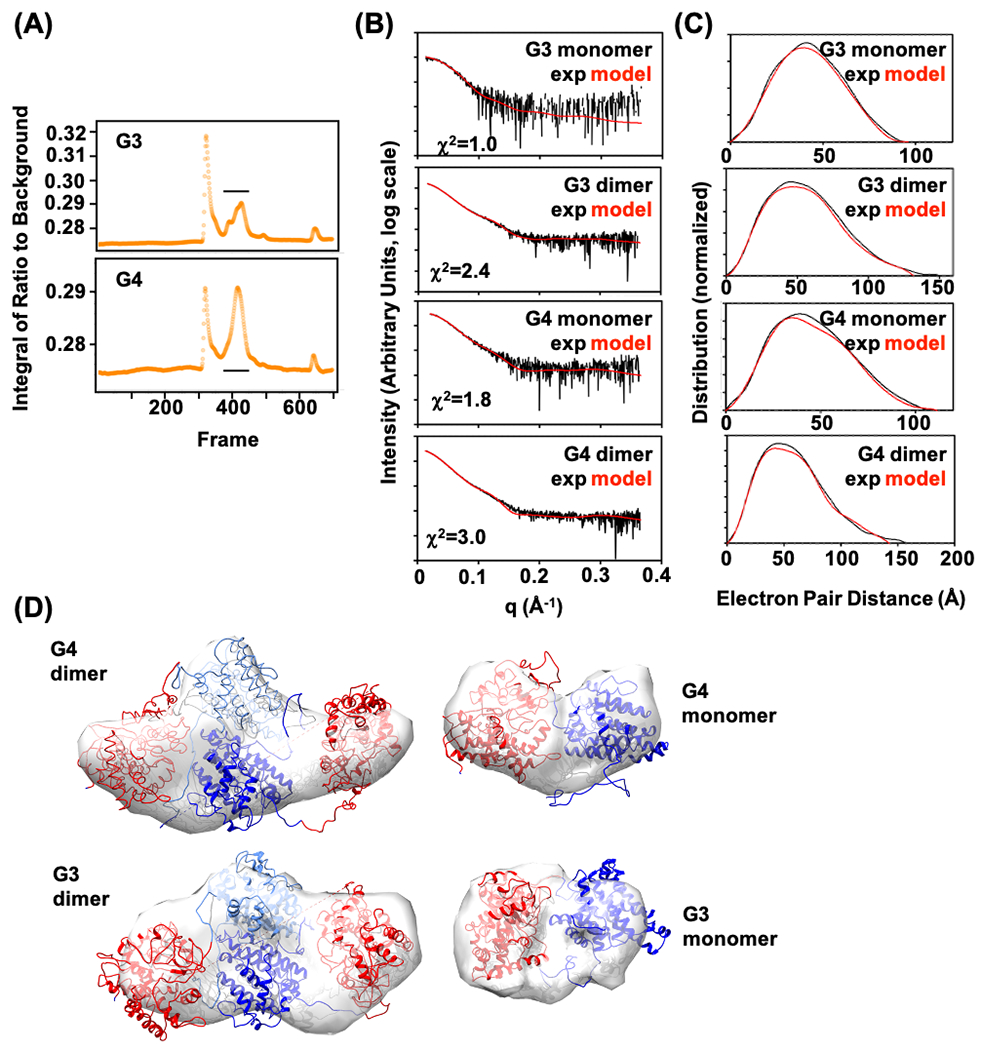
Figure 5.

SAXS analysis of enzyme fusions. (A) SEC-SAXS chromatogram of G3 and G4 fusion proteins. The horizontal line indicates peak(s) that were further analyzed. (B) Reciprocal space SAXS curves after SVD, representing scattering from monomer and dimer for G3 and G4 enzyme fusions, overlaid with curves predicted from models that best fit the experimental data (red curves). χ2 fit of models is shown. (C) Corresponding real space SAXS curves with experimental and model curves overlaid. (D) Ab initio shape predictions overlaid with the best-fitting model. Models were based on 1,8-cineole synthase (PDB ID: 5NX6, blue) and P450cin (PDB ID:1T2B, red).
