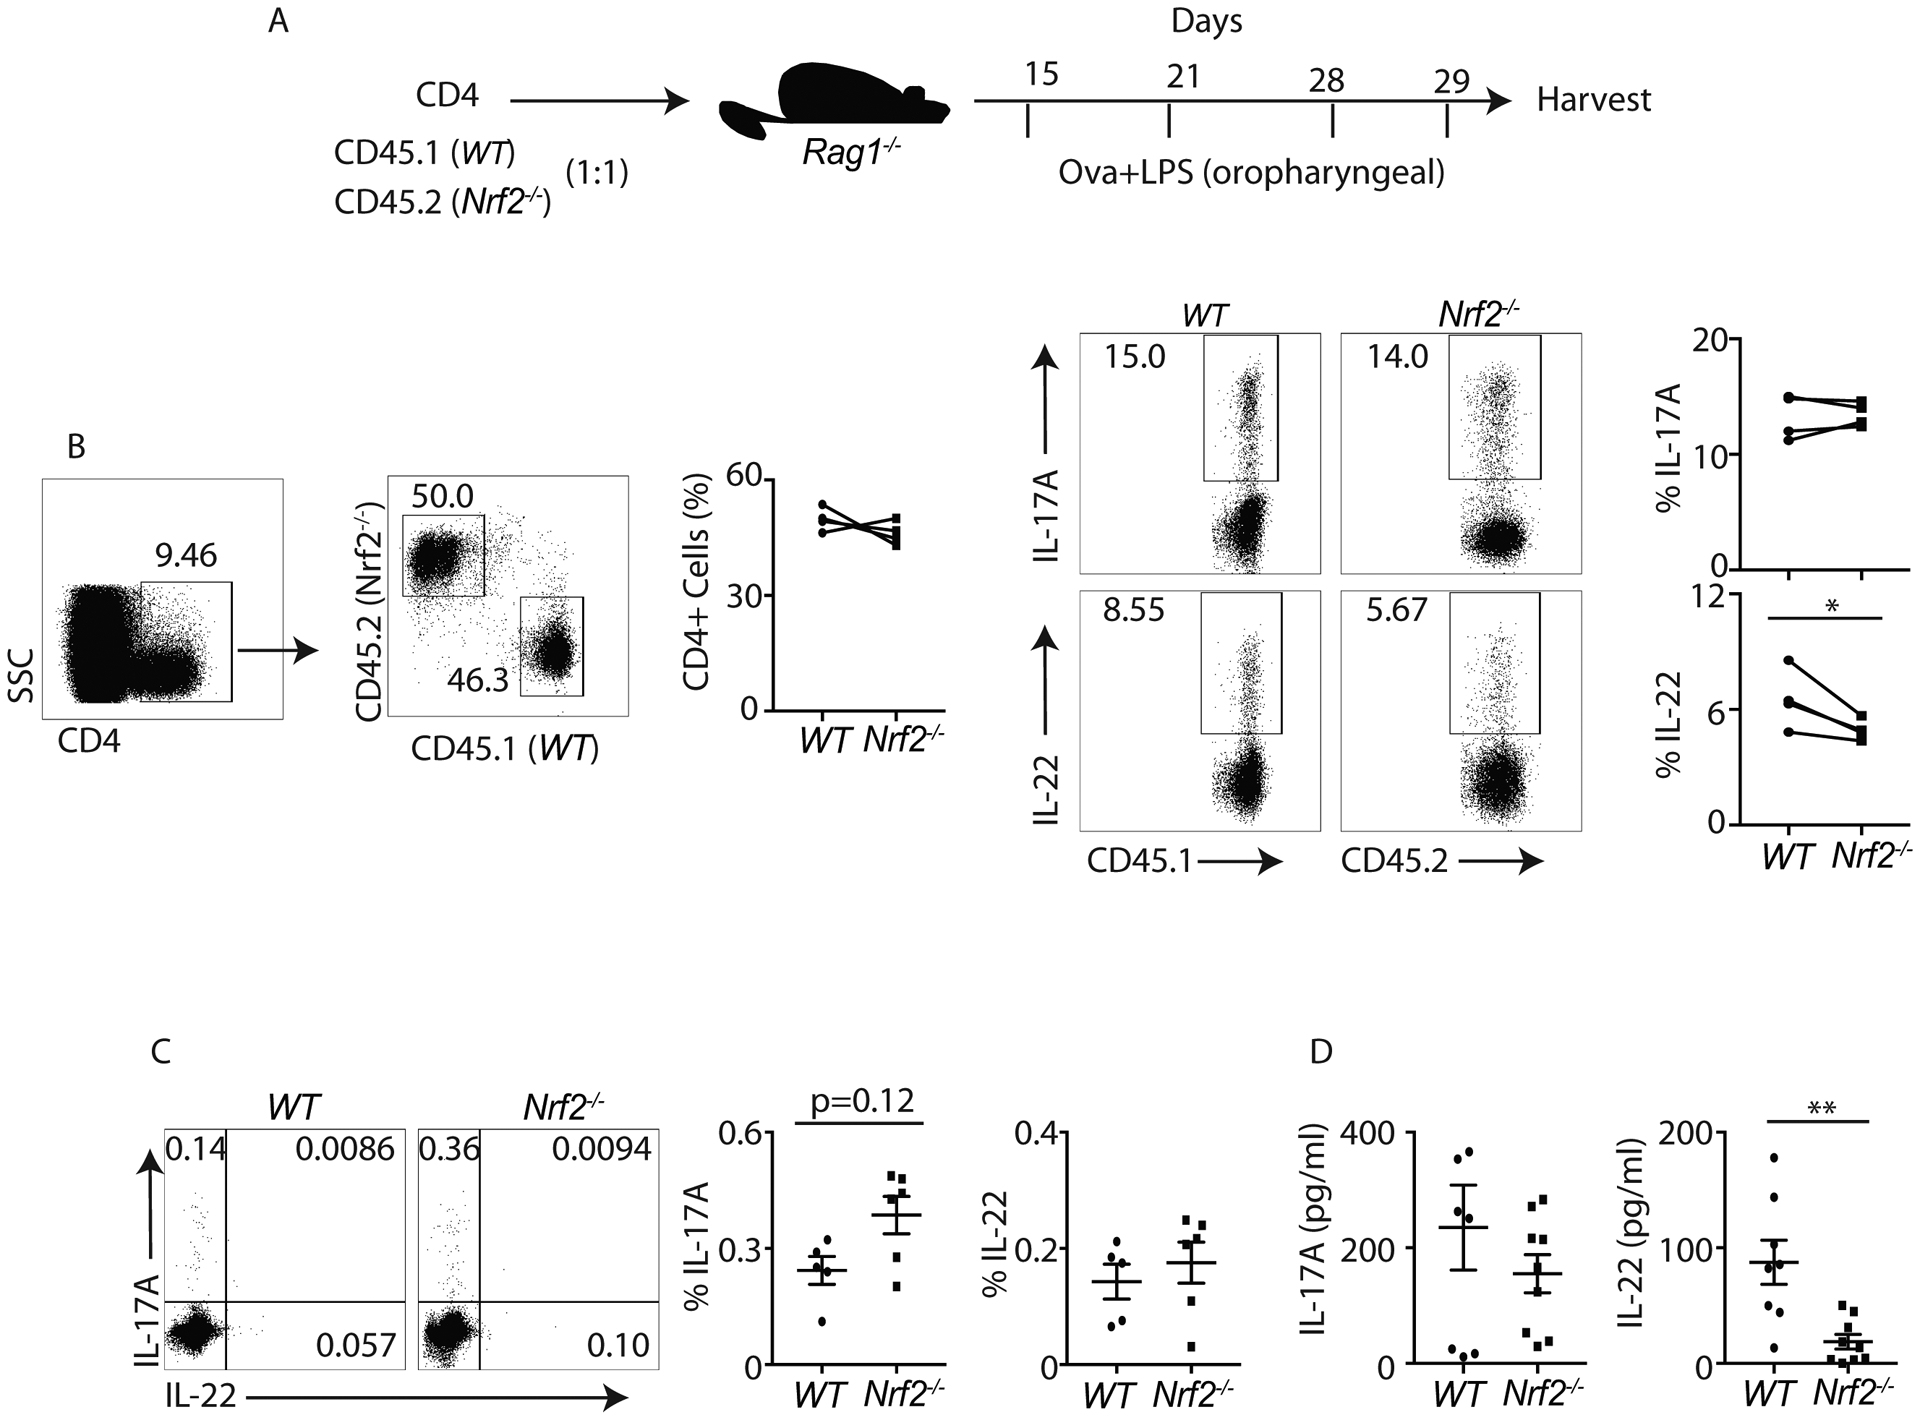
Figure 3: IL-17A and IL-22 responses in WT and Nrf2−/− mice in vivo:

A) Schematic diagram shows OVA+LPS experimental strategy.
B) One day after last OVA+LPS administration, lung-derived lymphocytes from WT and Nrf2−/− mice were isolated and restimulated with PMA+Ionomycin. IL-17A or IL-22 producing CD4+ T cells were analyzed by flow cytometry. Data show the percentage of CD4+ T cells producing IL-17A or IL-22.
C and D) At 2 hours post ConA administration, WT and Nrf2−/− splenocytes were harvested and restimulated with BD leukocyte activation cocktail (1:200). Flow cytometry was utilized to examine the frequency of IL-17A or IL-22 producing CD4+ T cells (gated on CD3+CD4+) (C). Serum IL-17A and IL-22 concentrations were quantified by ELISA (D).
Figure 3C and 3D was generated from 2 independent experiments. Each symbol indicates experiments from a separate animal. Data presented as mean ± SEM on relevant graphs. *P ≤ 0.05; **P ≤ 0.01 (Mann-Whitney test, Two-tailed).
