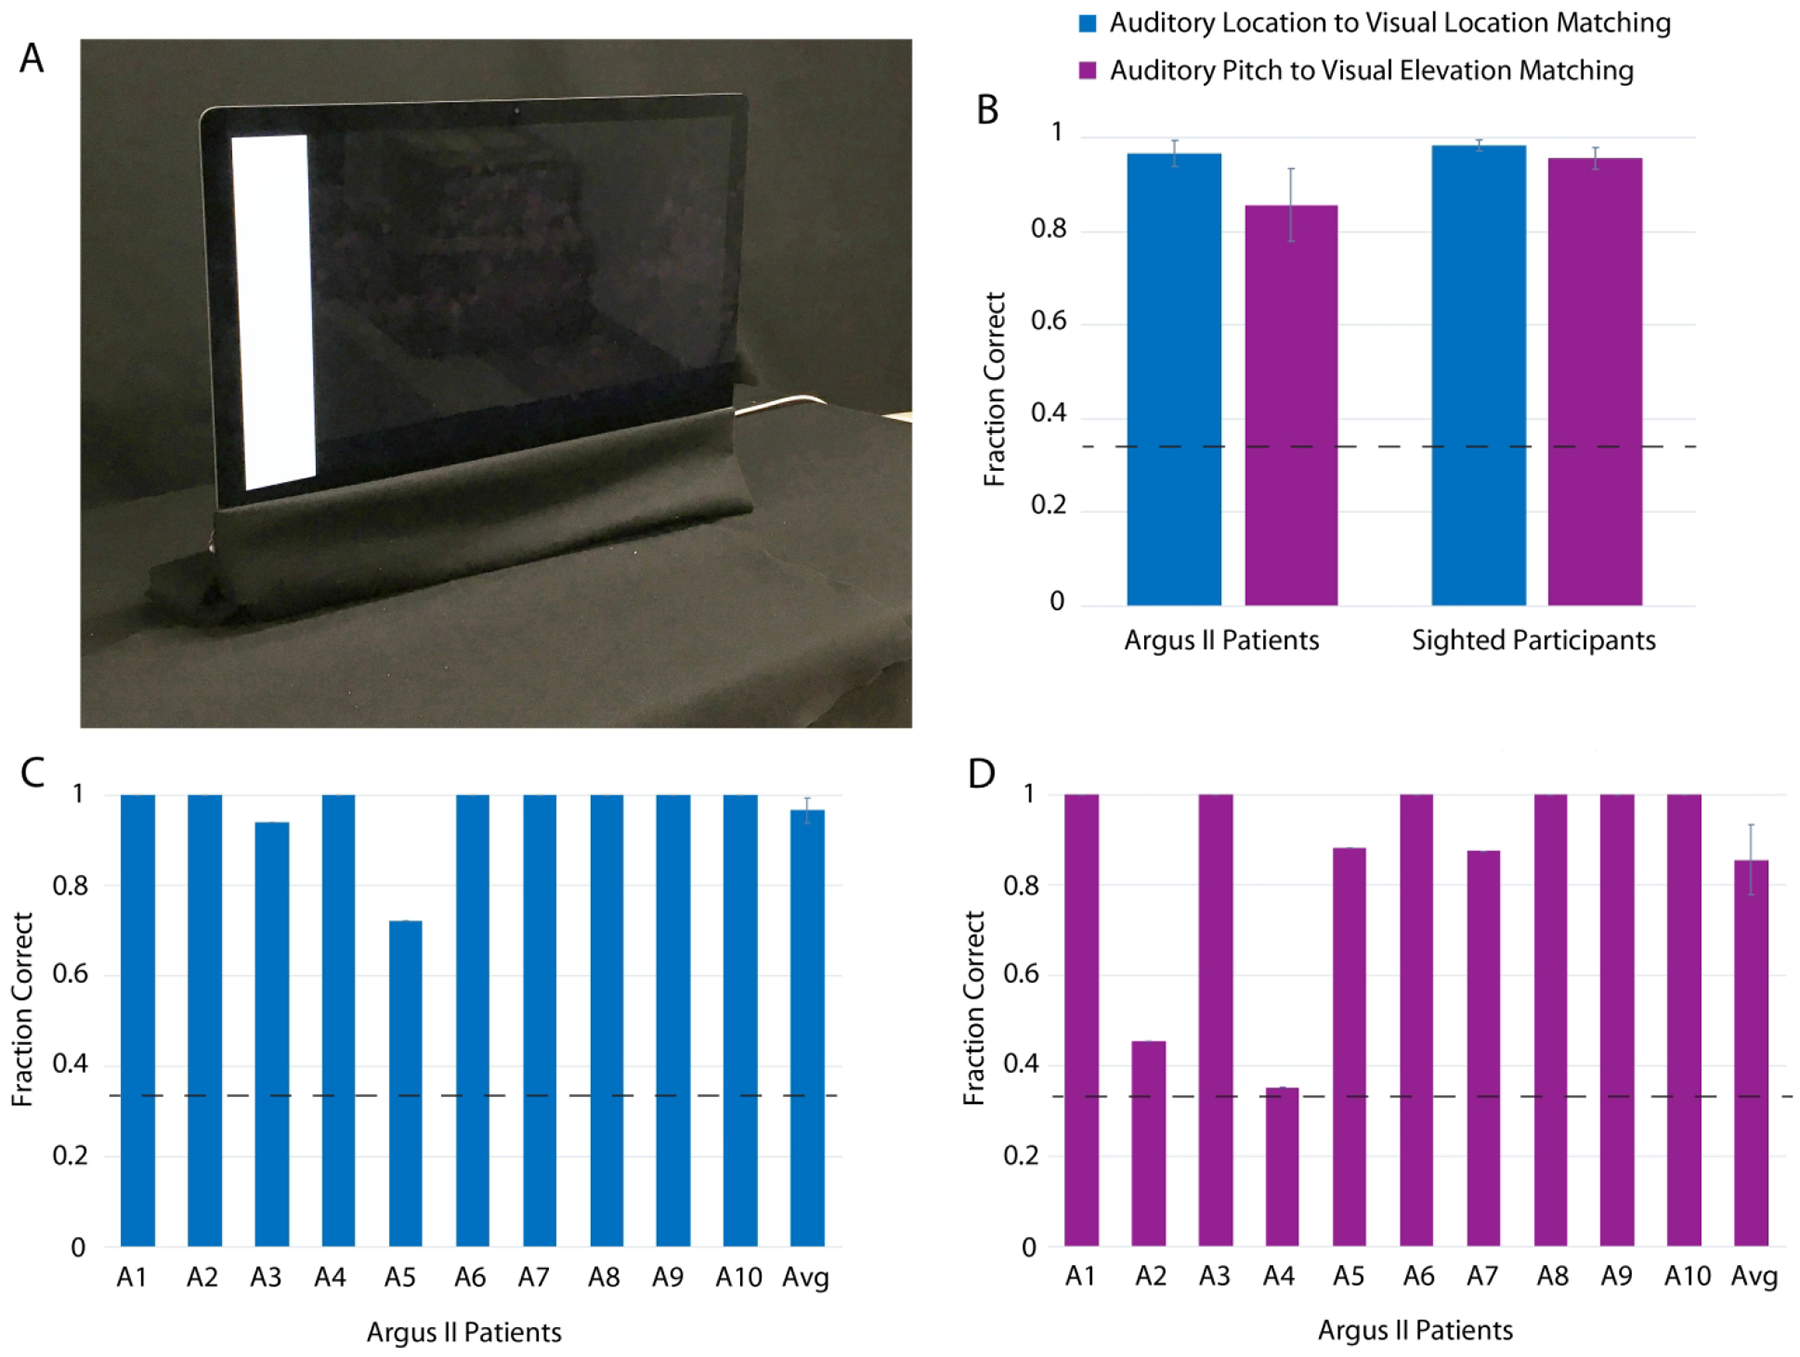
Fig. 3. Crossmodal Correspondences Results in Argus II and Sighted Subjects (Experiment 1).

The experimental setup at the University of Southern California for both crossmodal correspondence experiments is shown in Panel A. The fraction correct for matching auditory to visual stimuli is shown in Panel B for both Argus II patients (N = 10) and age-matched sighted controls (N = 10). The fraction correct for matching auditory to visual stimuli in Argus II patients (N = 10) is shown in Panels C and D (Panel C for the mapping of auditory location to visual location, and Panel D for the mapping of auditory pitch to visual elevation). The individual patient fraction correct results for each Argus II patient in Panels C and D do not have error bars as they represent one data point for each patient; however, the averages in Panels C and D do have error bars as they sum across patients. The error bars represent ± standard error of the mean across participants. The dashed lines represent chance. See also Figs. S4 and S5, and Table S2.
