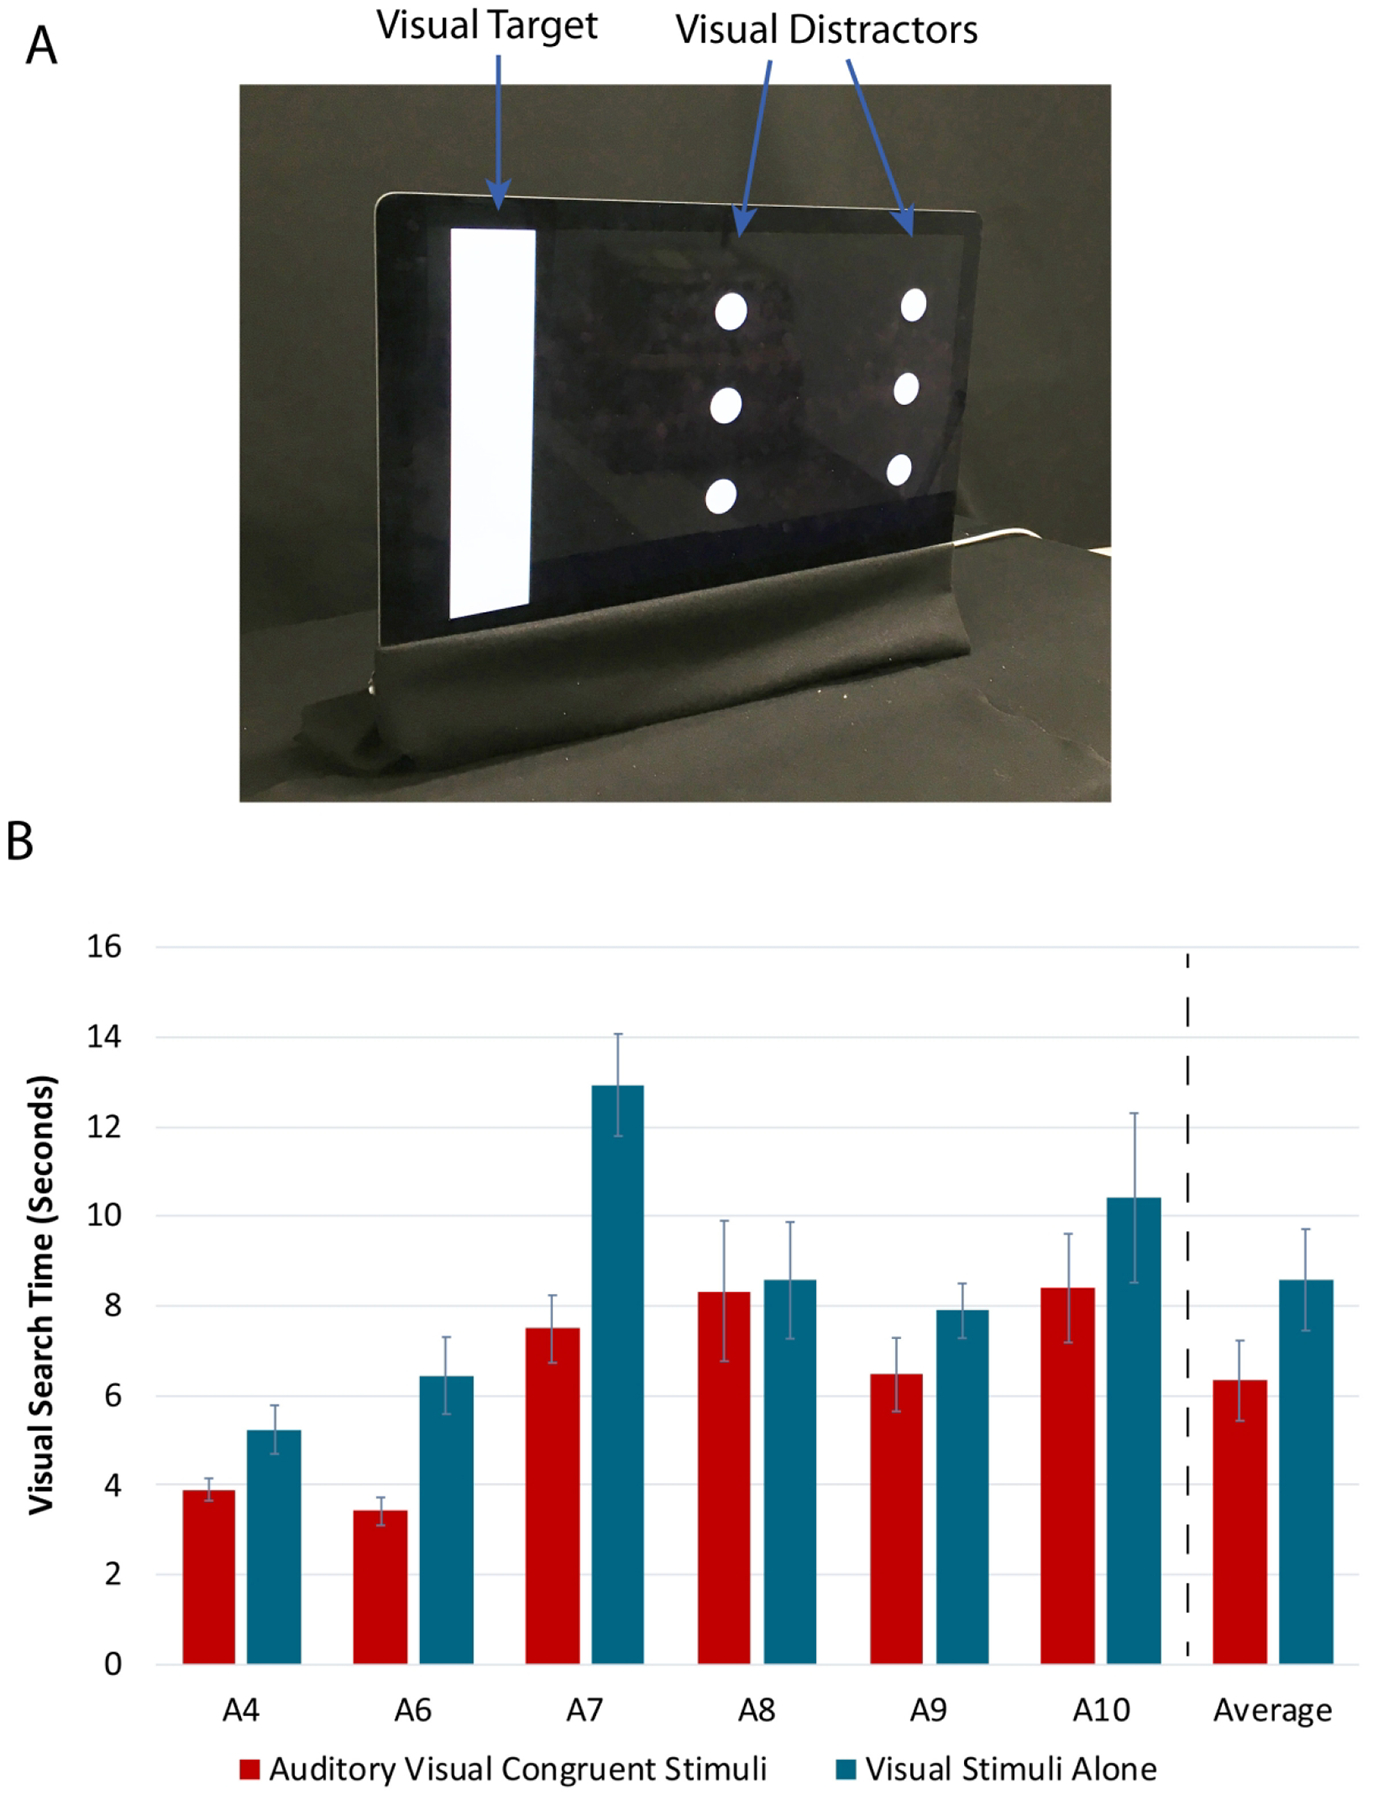
Fig. 4. Visual Search Task Setup and Results with Argus II Patients (Experiment 3).

A representative image of the visual stimuli in the visual search task is shown in Panel A with the visual target and visual distractors labeled. The time to detection results for the visual search task in Argus II patients (N = 6) is shown in Panel B. The full length of the error bars represent ± standard error of the mean across trials for individual results, and across participants for average results. See also Fig. S6.
