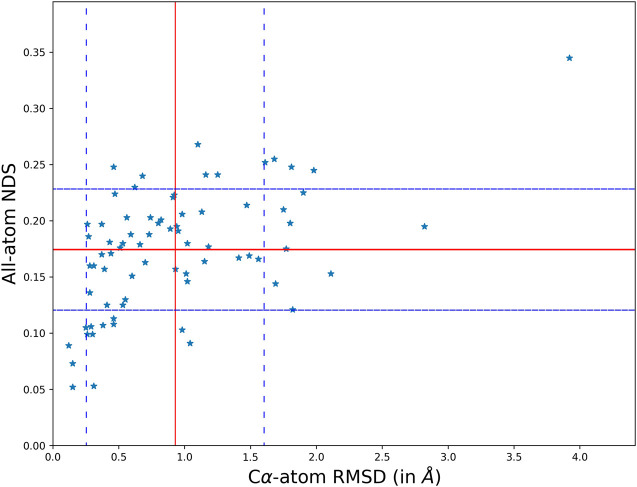
FIGURE 1.
A scatter plot comparing the structural topology (Cα positions) and PSN of the wildtype and mutant using RMSD and NDS respectively. The comparison scores for each disease case are plot on the scatter. It is found that the structural divergence and network dissimilarity do not share strong linear relationship.

