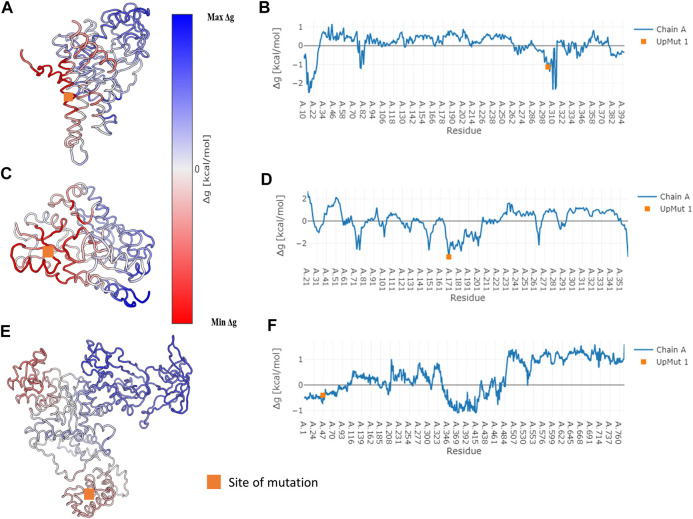
FIGURE 4.
Free energy values obtained for three specific proteins that undergo disease-causing mutation. Specific cases where we observe significant network variability have been subject to the analysis of allosteric effects due to mutation. The AlloSigMA server employs the SBSMMA (Guarnera and Berezovsky, 2016) method to generate the response free energies when perturbations (UP mutation) are introduced at known sites of disease-causing mutations. Cartoon of the wildtype coloured according to their free energy values obtained for the cases of (A) Medium-chain specific acyl-CoA dehydrogenase, (C) Porphobilinogen deaminase and (E) Glutamine--tRNA ligase are shown on the left. Their free energy profiles are illustrated graphically with residue index on the x-axis and Δg value on the y-axis in (B), (D) and (F) shown on the right in the same order. The orange square points to the site of mutation.

