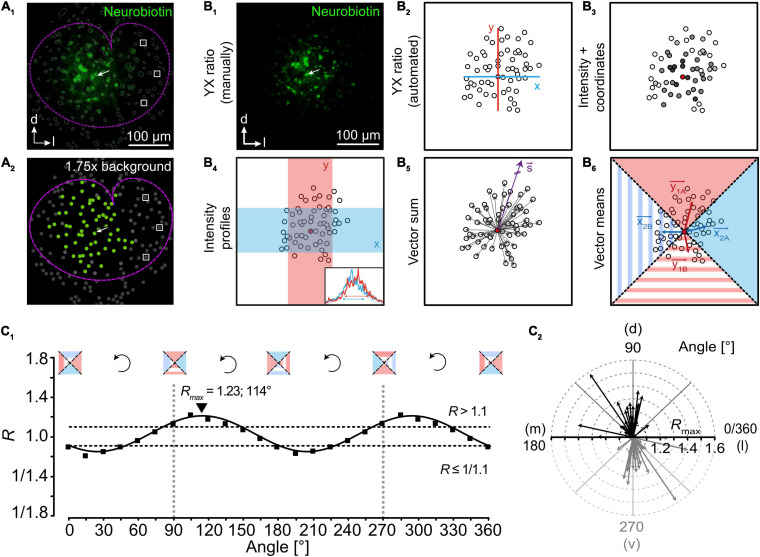
FIGURE 4.
Analysis of network topography. (A) Detection of coupled cells. Astrocytes in the lateral superior olive (outlined by dotted magenta line) form large tracer-coupled networks (A1; green). All identified cells are encircled with a thin gray line. Semi-automated detection of coupled cells is achieved by determining background fluorescence levels of cells (white boxes) being far located from the tracer-filled cell (arrow). Setting a threshold allows for unbiased selection of coupled cells (A2; green: coupled cells; gray: not coupled cells). (B) Approaches to study the topography of tracer-coupled networks. Anisotropy is often determined by the ratio of tracer spread (distance and/or intensity) in two directions that are orthogonal to each other (B1–4,6). Alternatively, a purely vector-based approach can be used (B5). (C) In case of ratio-based analyses, rotation of the coordinate system allows the precise determination of maximal anisotropy and orientation (C1; exemplarily shown for vector means, B6). Afterward, results can be gathered in a radar diagram to denote the degree of anisotropy and orientation of networks (C2). Figure modified from Eitelmann et al. (2019).

