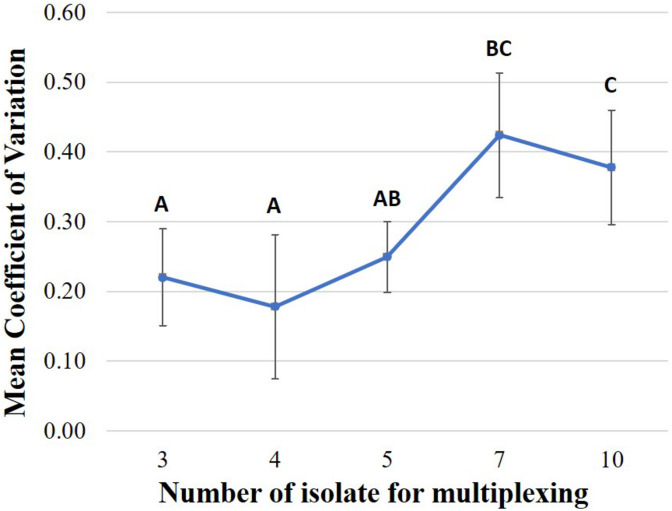
FIGURE 5.
Comparison of the coefficient of variation of the proportion of data yield per multiplexed isolate in one flow cell under each multiplexing strategy including multiplexing three, four, five, seven, or ten isolates (Sequencing time: 48 h). Based on the statistical analysis results of Tukey HSD test, multiplexing strategies with different letters were significantly different (P-value < 0.05) from each other in coefficient of variation.

