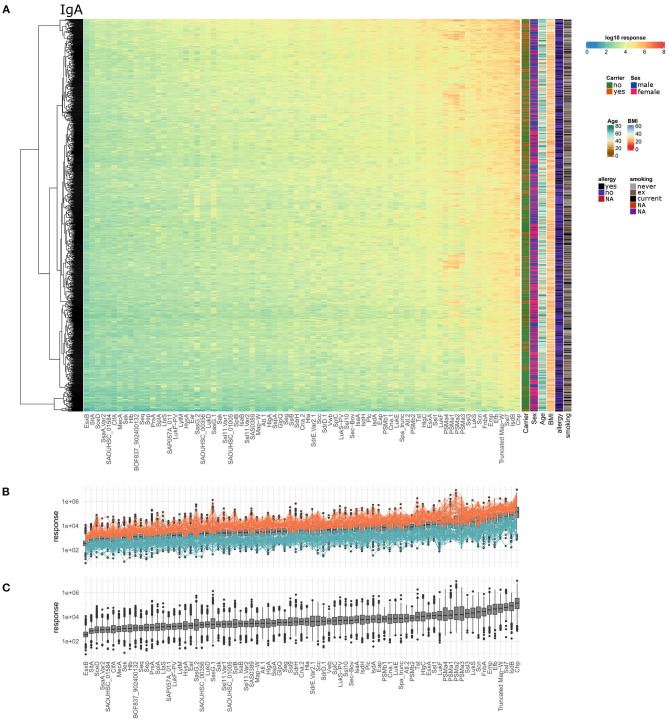
Figure 4.
Serum IgA titers against S. aureus are highly variable with very large differences among the 996 tested individuals as well as the 79 included staphylococcal antigens. (A) The calculated IgA response values of all 996 individuals (y-axis) were plotted against the 79 antigens (x-axis) on a log10-transformed scale. Phenotypic information on the individuals was included in the additional columns on the right of the heatmap including carriage status, sex, age, BMI, allergy, and smoking. (B) Overview of overall high (orange) and overall low (petrol) responders, the calculated response is plotted as boxplot for all antigens and individuals, ordered with increasing median responses. (C) Ranking of the antigens according to IgA responses from all individuals.

