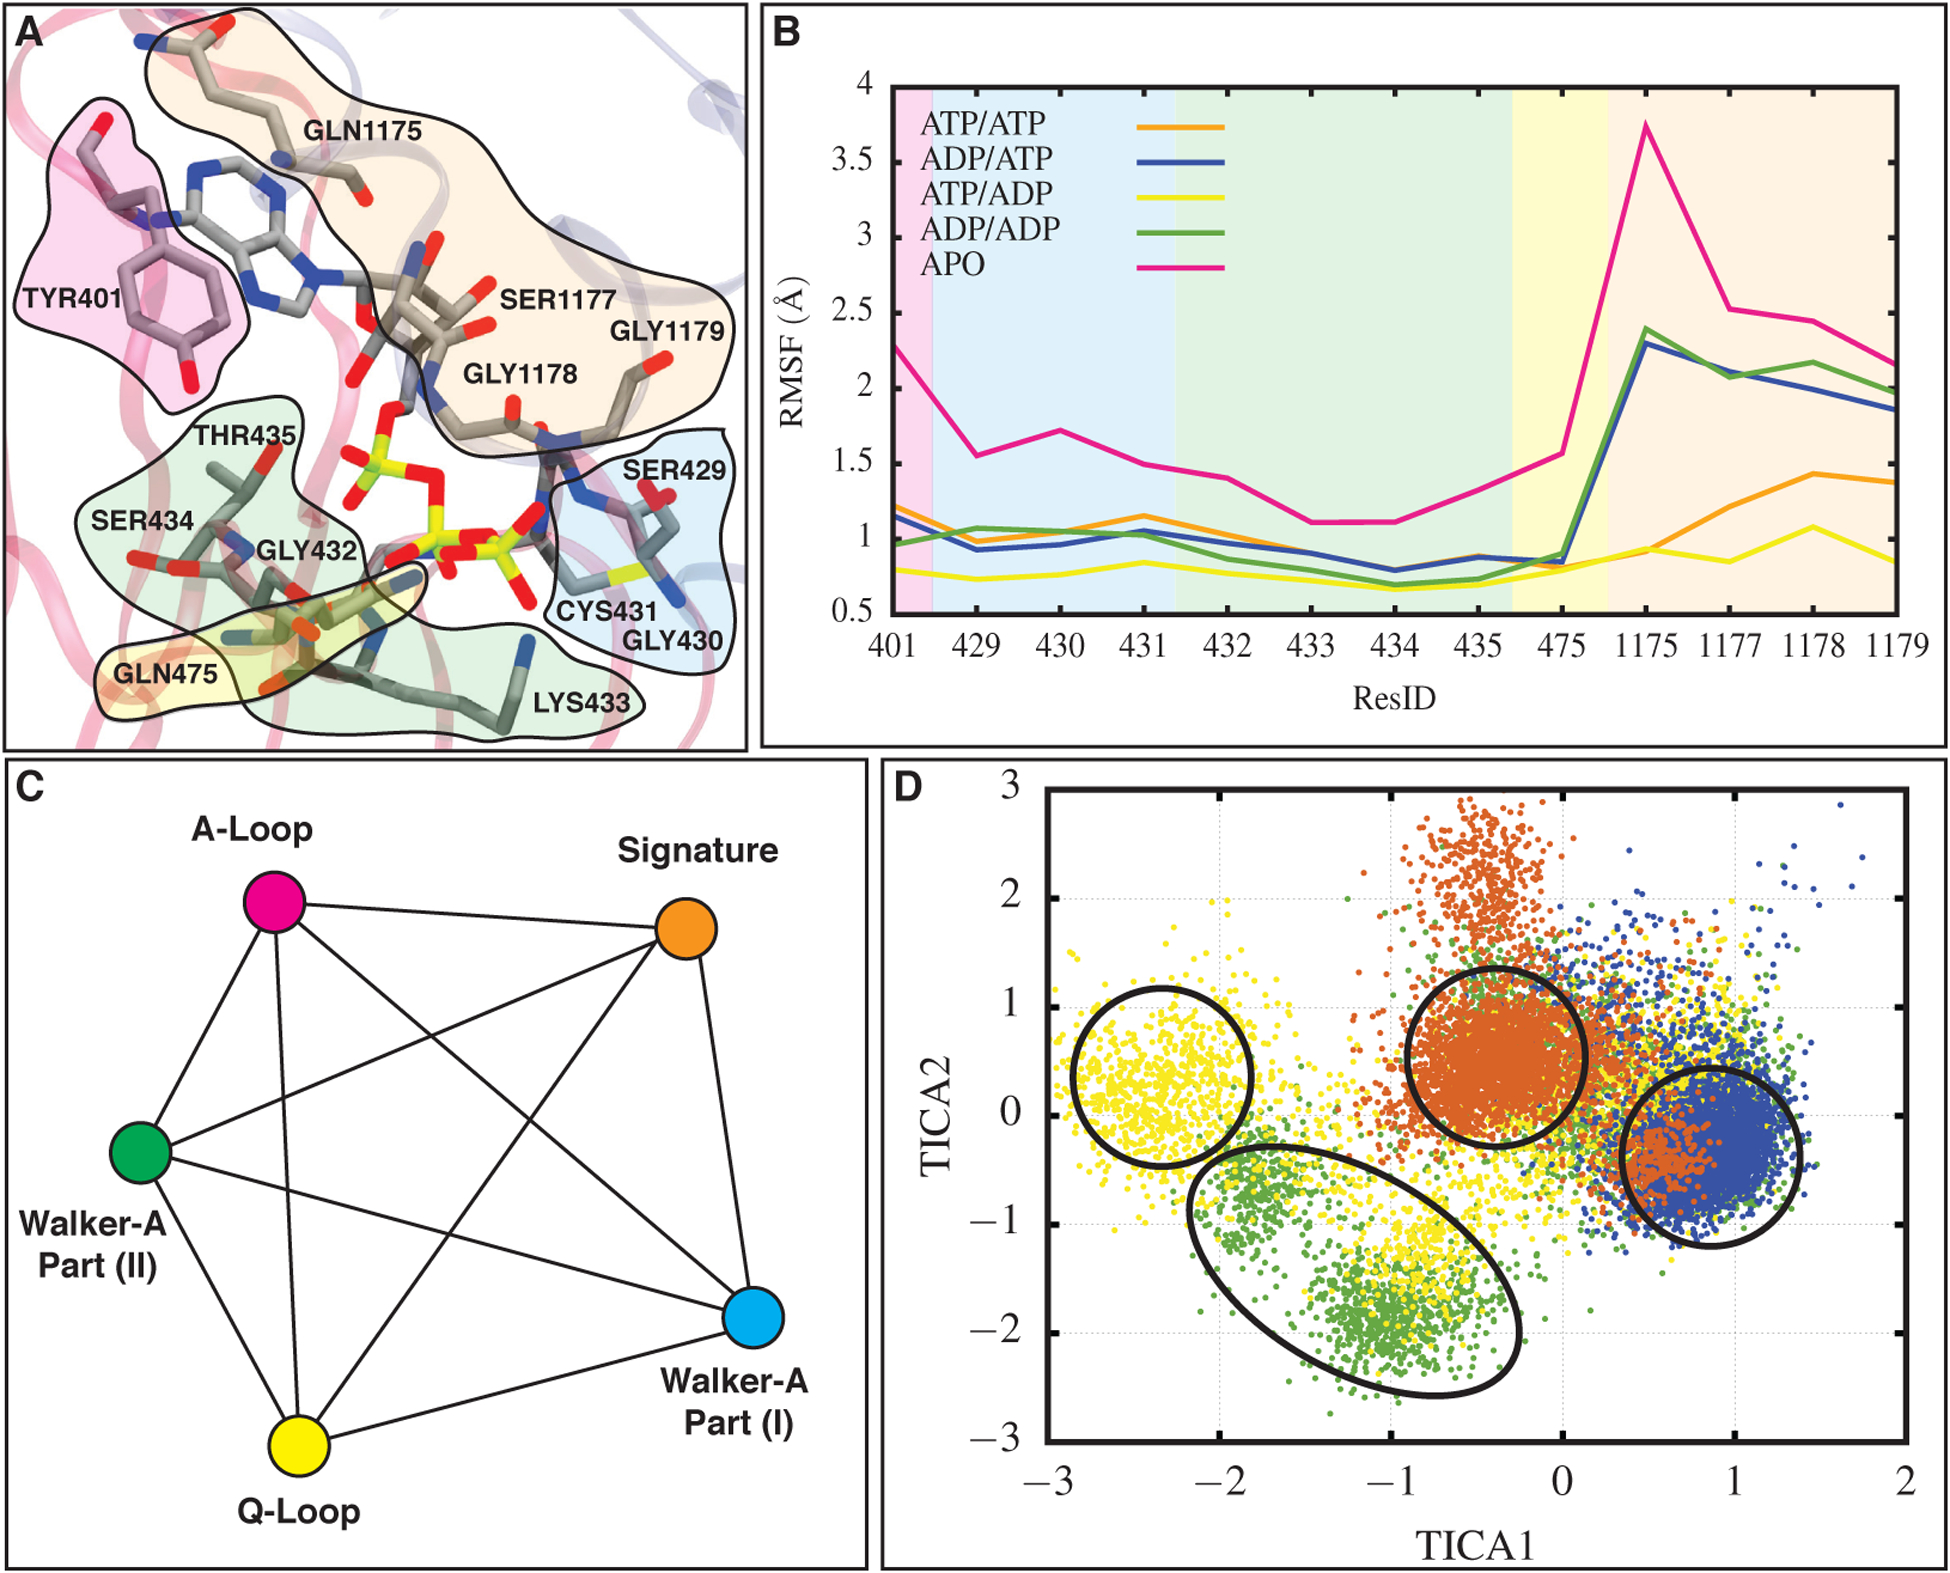
FIGURE 2.

Nucleotide binding site conformational changes in NBD1 for all simulated systems induced by ATP hydrolysis. (A) Nucleotide binding site in NBD1 for one of the ATP/ATP systems. Residues belonging to the A-loop, Walker-A motif part (I), Walker-A motif part (II), the signature motif, and the Q-loop are colored in magenta, blue, green, orange, and yellow, respectively. (B) RMSF values for the residues in the five regions highlighted in panel (A), calculated in different bound states of Pgp and averaged over the last 100 ns of all three replicas for each system. Background colors correspond to different regions of the nucleotide binding site and are consistent with colors in (A). As reflected in its high RMSF, the interactions between the signature motif and ATP are affected the most after ATP hydrolysis. (C) A network used to calculate the pairwise distances between different nucleotide binding regions. Each line represents a distance and each node corresponds to a region within the binding site. Colors here are consistent with (A). (D) The reduced dimension distance phase space constructed for NBD1. Colors representing each bound state are consistent with lines in (B). Highest population of ATP/ATP, ATP/ADP, ADP/ATP, and ADP/ADP systems occupy different regions in the phase space indicating a different configuration of the nucleotide binding site in each bound state (see Figure S4 for 10 calculated pairwise distances in NBD1 used to construct the phase space).
