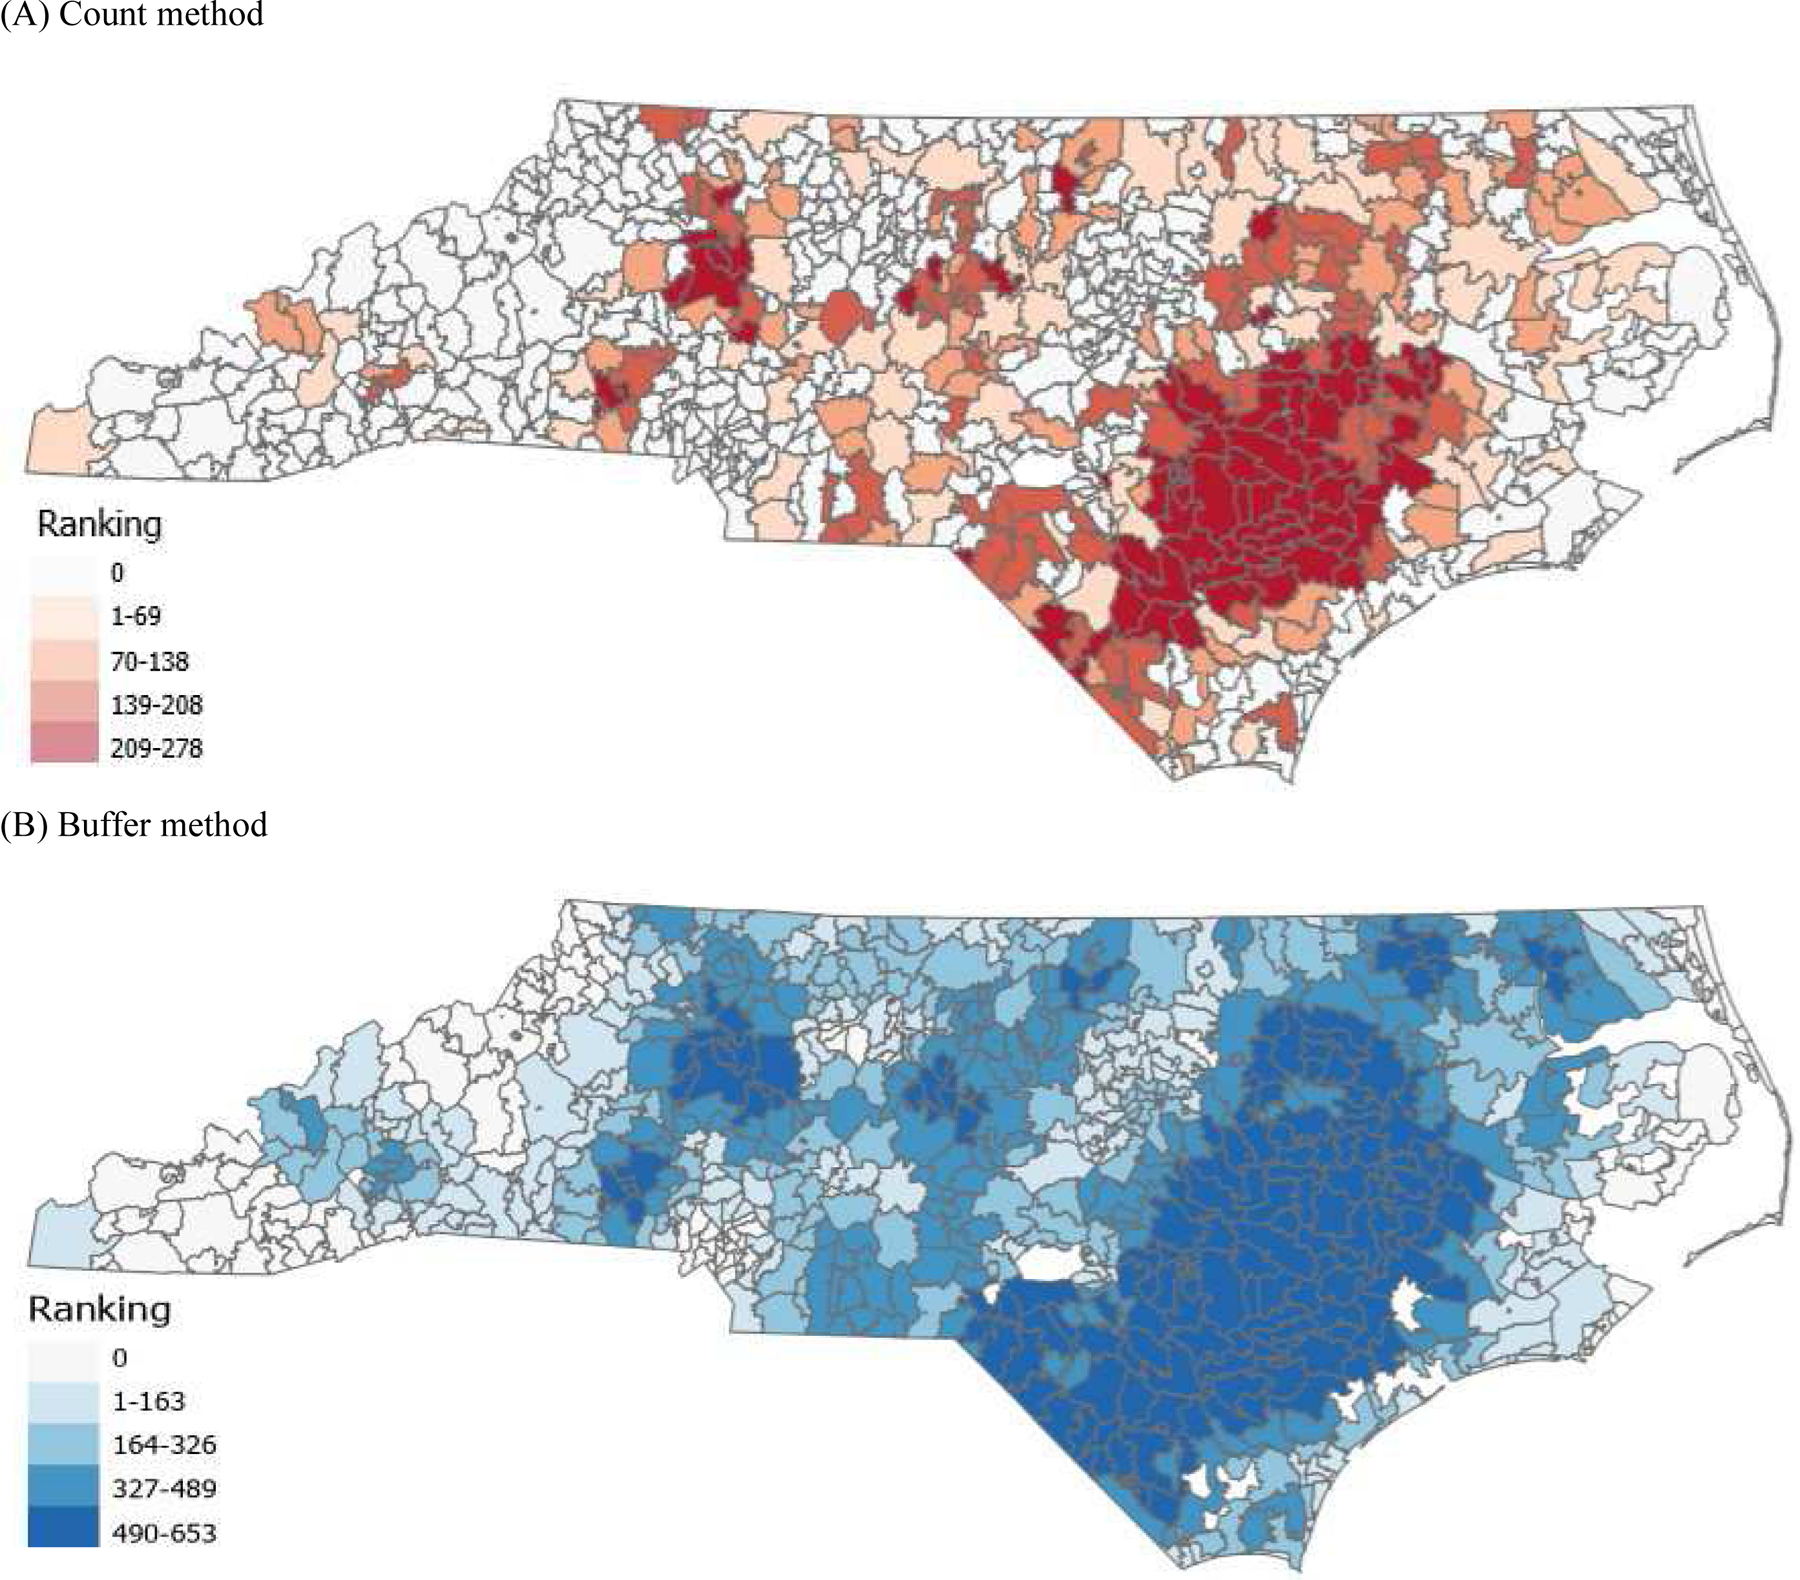
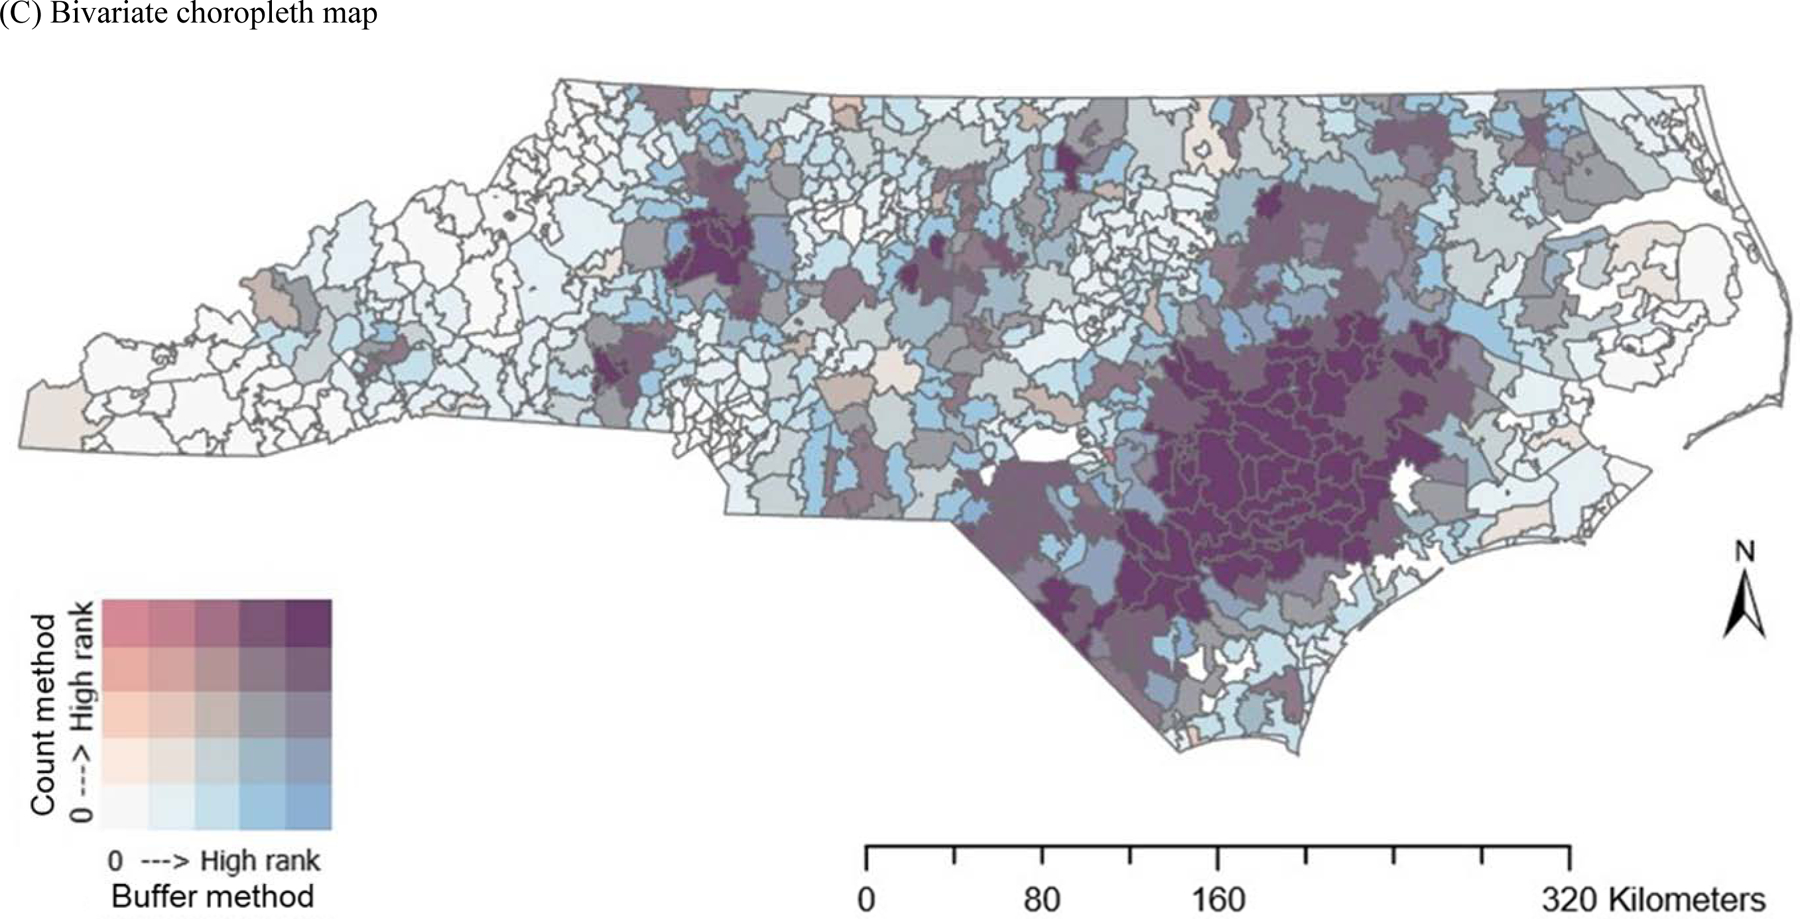
Figure 4.


Distribution maps of CAFOs exposure by (A) use of the count method, (B) use of the buffer method, and (C) displaying both methods simultaneously
Note: The ranks by ZIP code compare exposures for each method. The lower ranking reflects lower exposure (0 = lowest, with no exposure) and the higher ranking reflects higher exposure.
