FIGURE 3.

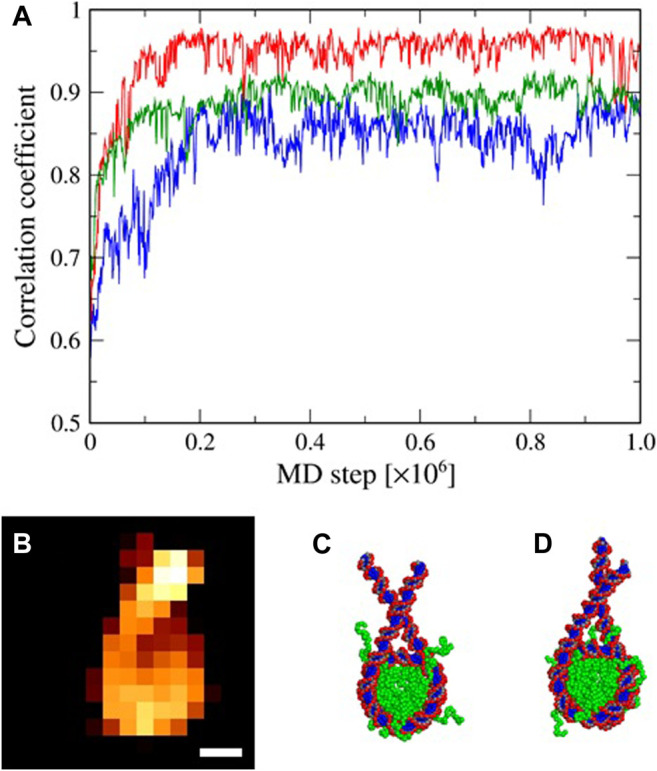
Flexible-fitting MD simulations. (A) Representative time series of the correlation coefficient (c.c.) of pseudo-AFM image of the simulated structure with the “experimental” AFM image. Shown here are results from three different values, 0.1, 0.3, and 0.5 nm in blue, red, and green, respectively. (B) The synthetic-AFM image used as an “experimental” AFM image in the flexible-fitting. Scale bar: 5 nm. (C) The nucleosome initial structure. (D) The simulated structure with the highest c.c..
