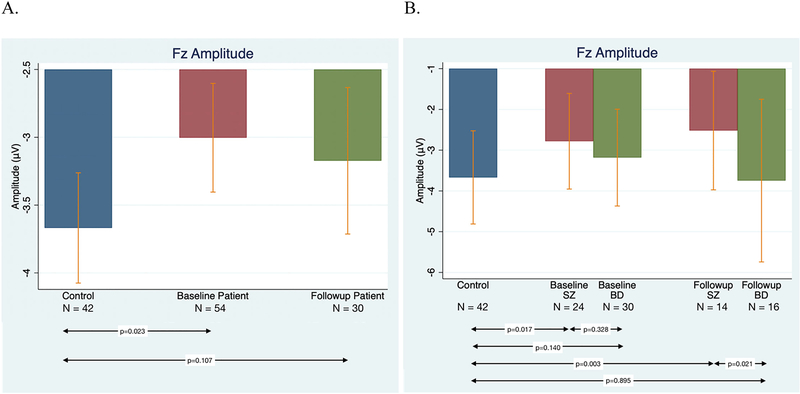
Figure 1.
Comparisons of MMN by Group and Diagnosis. Figure 1A) (left): Average Fz amplitudes for different groups. Amplitude for control subjects (blue), early psychosis (EP) patients at baseline (red), and EP patients at 12 months (green). Figure 1B) (right): MMN for control subjects (blue), SZ patients at baseline and 12 months (red), and BD patients at baseline and 12 months (green). (Note: vertical bars represent standard deviations.)

