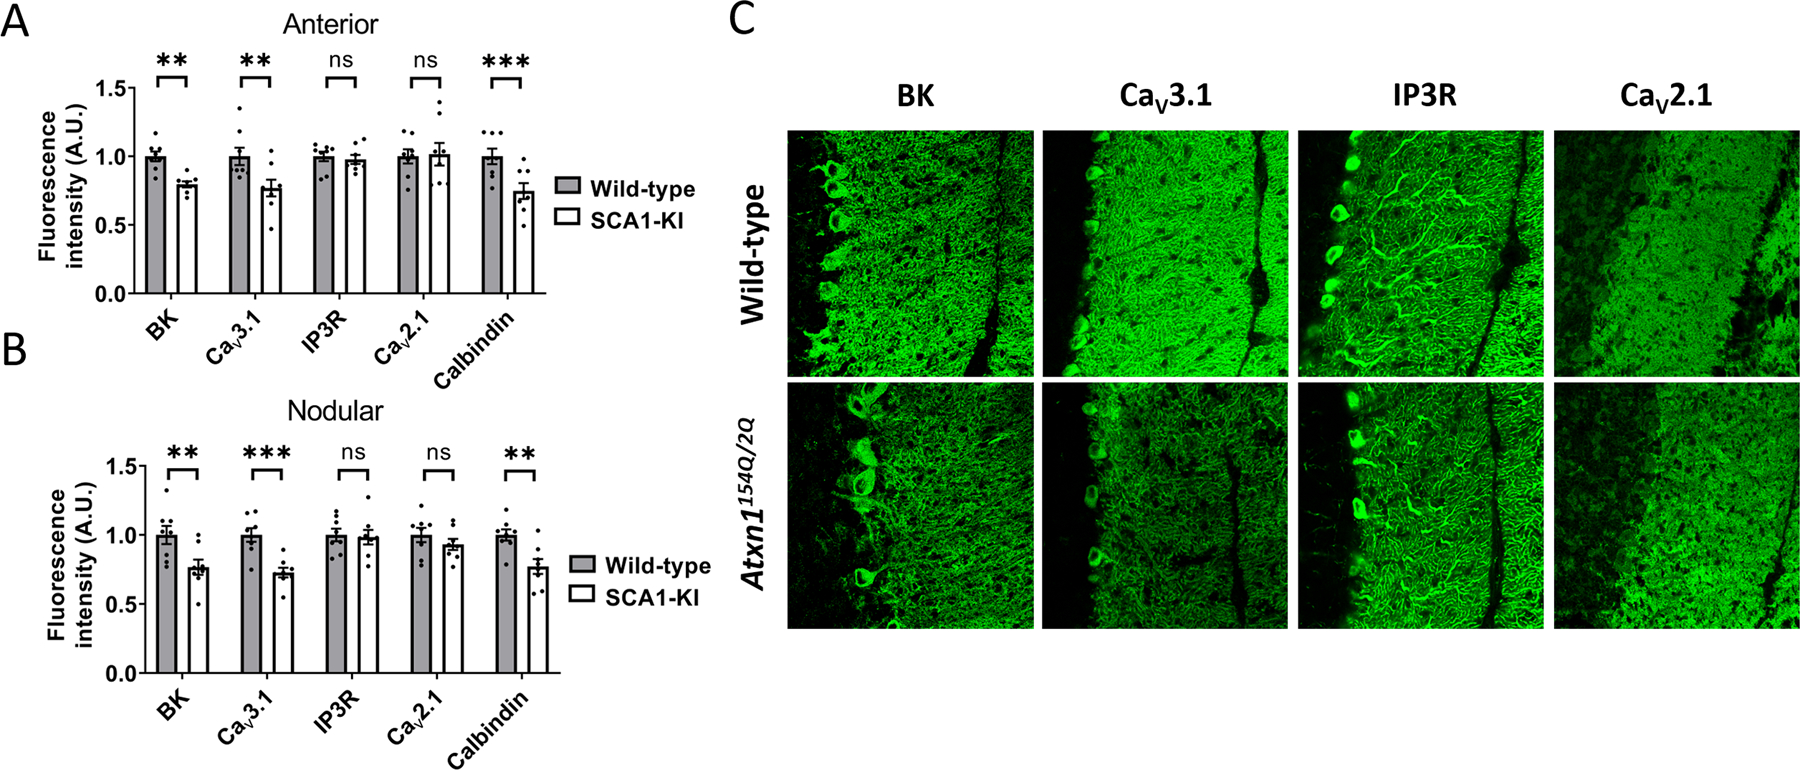
Figure 2. Reduced expression of BK and CaV3.1 channels in Atxn1154Q/2Q cerebellum.

(A) Ion channel expression was measured in the anterior cerebellum (lobule 5) molecular layer of 14 week-old Atxn1154Q/2Q mice and wild-type littermate controls. (B) Ion channel expression was measured in the nodular zone (lobule 10) molecular layer of 14 week-old Atxn1154Q/2Q mice and wild-type littermate controls. (C) Representative 40x confocal microscopy images from the anterior cerebellum are shown for (C) BK, CaV3.1, IP3R, and CaV2.1 in Atxn1154Q/2Q mice and wild-type littermate controls. ** denotes p<0.01; *** denotes p<0.001; ns denotes p>0.05. Two-tailed Student’s t-test (F), with Holm-Sidak correction for multiple comparisons used in (A-B).
