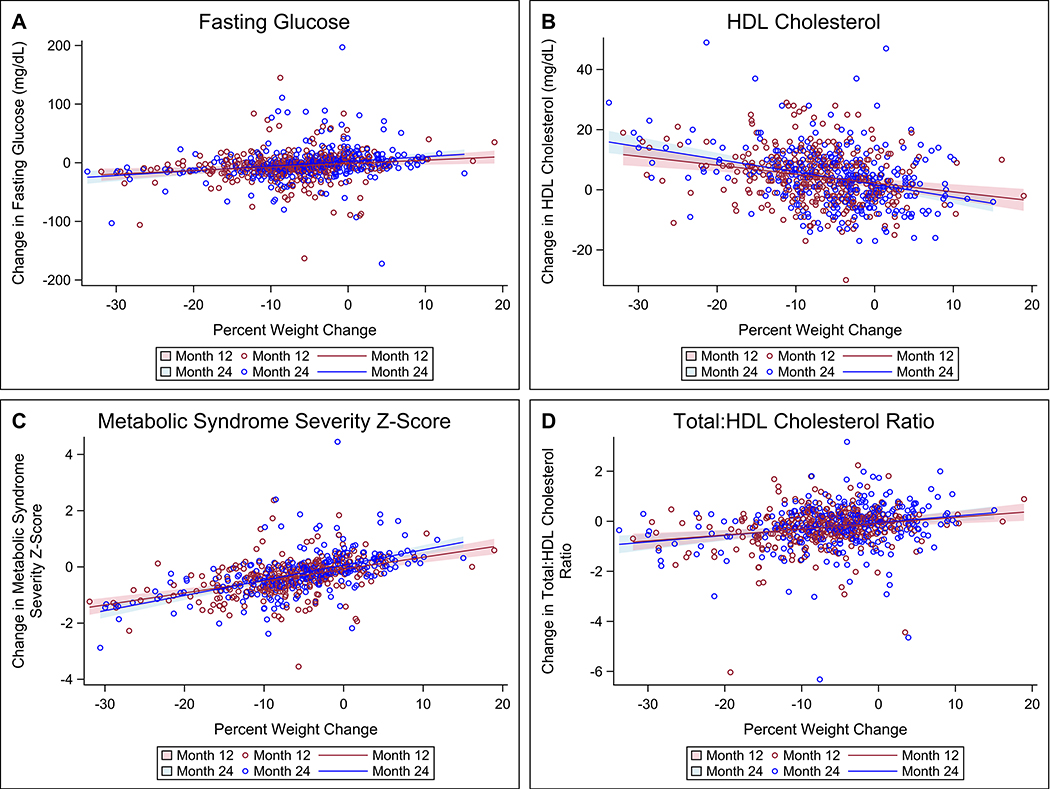
Figure 2. Association between percent weight change and change in fasting glucose levels (A), HDL cholesterol (B), Metabolic Syndrome Severity Z-Score (C), and total:HDL cholesterol ratio (D).
The mixed linear regression models included weight change and change in the respective cardiometabolic risk factor for all available timepoints, producing different slopes and 95% confidence intervals (shaded area) of the regression lines at each timepoint. To improve readability, the random clustering effects of the clinics are not incorporated in the graphs as this would yield nine regression lines (one for each clinic) for each timepoint.

