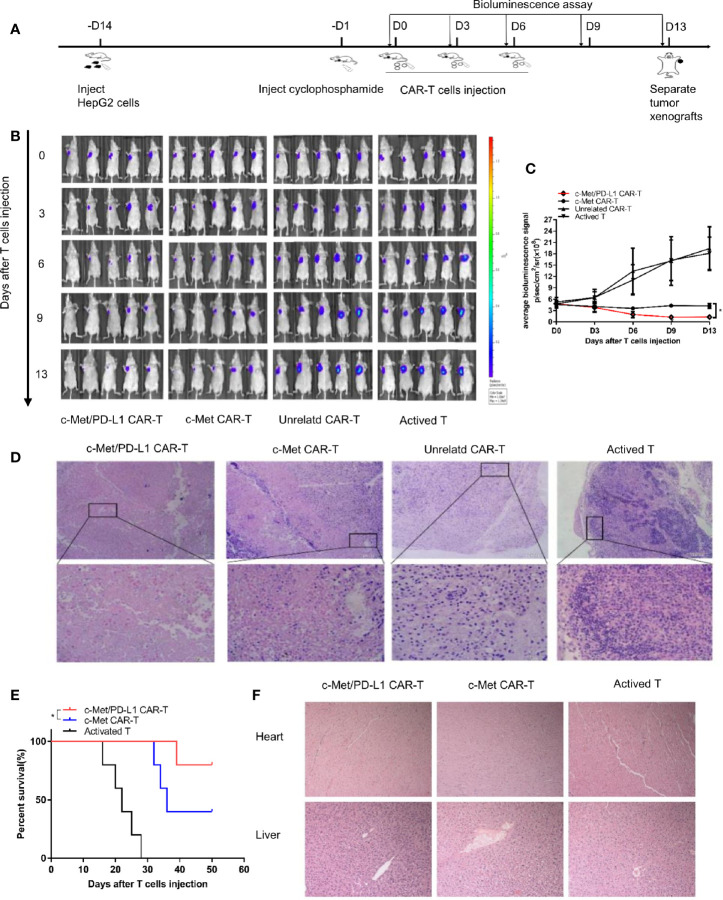
Figure 4.
In vivo antitumor activities of c-Met/PD-L1 CAR-T cells against c-Met/PD-L1 positive subcutaneous HCC tumors. (A) Schematic representation the subcutaneous implantation of HepG2-fLuc cells and treatment of CAR-T cells. (B) Mice bearing HepG2-fLuc subcutaneous xenografts progression was assessed by bioluminescence assay on day 0, 3, 6, 9, and 13(n=5). (C) Quantification of tumor burden was depicted according to the bioluminescence signal. (D) Representative H&E images of tumor xenografts were taken with a microscope under 100x and 200x magnification. (E) Kaplan–Meier survival curves of mice treated with CP CAR-T cells, c-Met CAR-T cells and activated T cells (n=5). (F) Representative H&E images of normal organ of mice treating with CP CAR-T cells, c-Met CAR-T cells and activated T cells were taken with a microscope under 100x magnification. Data are shown as mean ± SD. *p < 0.05.

