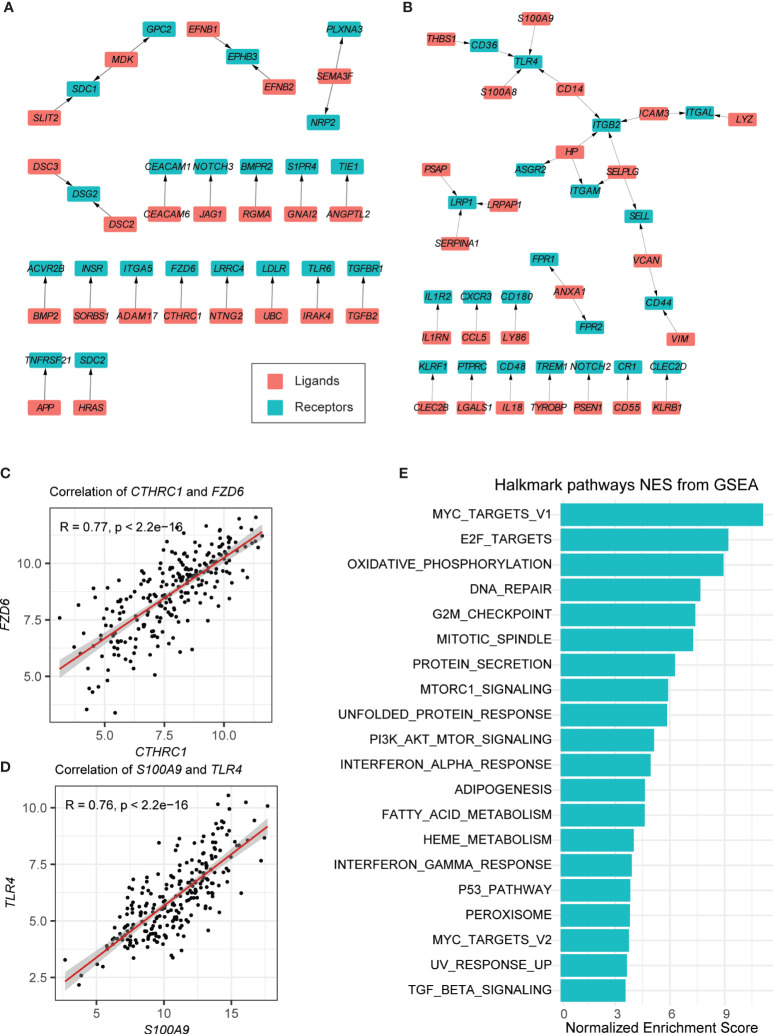
Figure 2.
Autocrine ligand–receptor pairs network in tumor-related B cells. (A, B) Ligand–receptor pairs that were upregulated (A) and downregulated (B) in B cells. Red and green squares represent ligands and receptors, respectively, and arrows point from ligands to receptors. (C, D) Spearman correlation coefficients of two ligand–receptor pairs (CTHRC-FZD6 and S100A9-TLR4). (E) GSEA of the hallmark pathways in tumor-related B cells.

