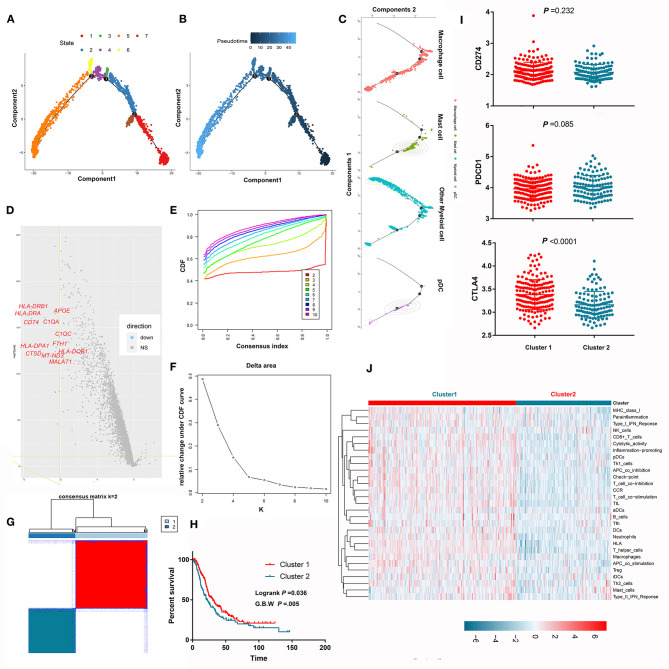
Figure 6.
Pseudotime trajectory analysis revealed the evolutionary characteristics of myeloid cells. (A) Pseudotime trajectory analysis revealed 7 different states of myeloid cells. (B) The gradation of color reflects pseudotime flows. (C) The pseudotime trajectory of each cell type in PDAC. (D) The volcano plot shows that many antigen-presenting molecules and complement-associated genes were lost along the pseudotime flow. (E–G) Unsupervised consensus clustering identified two independent subclusters based on the expression levels of the differentially expressed genes between two cell states spanning the longest pseudotime. (H) Survival analysis showed that the prognosis of patients in subcluster 1 was significantly better than that of patients in subcluster 2. (I) Comparison the expression of immune-check point between subcluster 1 and subcluster 2. (J) Comparison of the activity of 29 immune signatures between subcluster 1 and subcluster 2.

