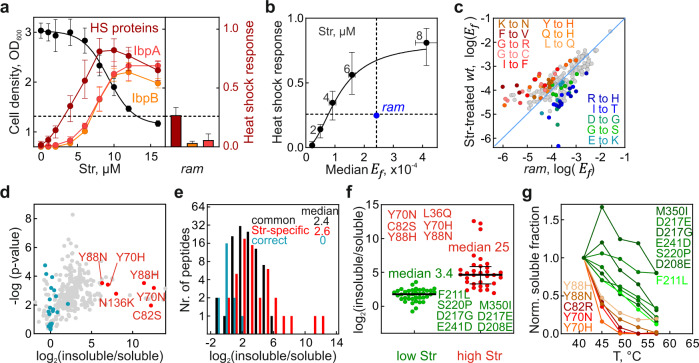
Fig. 1. Fitness, stress response, and miscoding of Str-treated wt and non-treated error-prone ram cells.
a Str-induced growth inhibition and heat-shock (HS) response with E. coli wt cells (left panel) and analysis of the HS response in error-prone ram cells without AGA (right panel). Cell density at OD600 (left Y-axis; shown are means ± standard deviation (SD) of three biological replicates (n = 3)). Proteome changes were quantified by label-free quantification (LFQ). Co-regulated proteins were identified by hierarchical clustering (Supplementary Fig. 1a–e). LFQ values were normalized to interval (right Y-axis). IbpA and IbpB were also plotted individually to show their delayed induction. Shown are medians ± interquartile ranges of three biological replicates (n = 3). The dashed line indicates the Str concentration at which the heat shock response is similar to ram cells. b Correlation between misreading and proteotoxic stress response for Str-treated wt cells (black) and untreated ram cells (blue). Error frequencies are means ± SEM of the medians of three biological replicates (n = 3). HS are median ± interquartile ranges. c Misreading profiles of wt Str-treated and ram cells (6 µM Str; Supplementary Fig. 1g), with Str-specific amino acid substitutions shown in warm colors; amino acid substitutions specific for ram strain are in cold colors. Shown are the means of three technical replicates (n = 3). d Volcano plot visualizing enrichment of amino acid substitutions in aggregates. Distribution between insoluble/soluble fractions of substitutions (gray) was normalized by the median of the correct peptides (turquoise). Selected substitutions enriched in aggregates are highlighted red. Shown are means of three technical replicates (n = 3). e Aggregation propensity of Str-specific amino acid substitutions. Categories of Str-specific and common errors are derived from Supplementary Fig. 1g (8 µM Str), data for the propensity to be enriched in aggregates from Fig. 1d. f Aggregation propensity of proteins with errors induced at low and high Str concentrations. Categories are from Supplementary Fig. 2a, data from Fig. 1d. Median ± interquartile ranges are shown. Unpaired, one-tailed t test: p value: 1.4 x 10⁻⁸. g Effect of errors on in-vitro thermostability of EF-Tu. Shown are means of three technical replicates (n = 3). See also Supplementary Figs. 1, 2, and Source data file.

