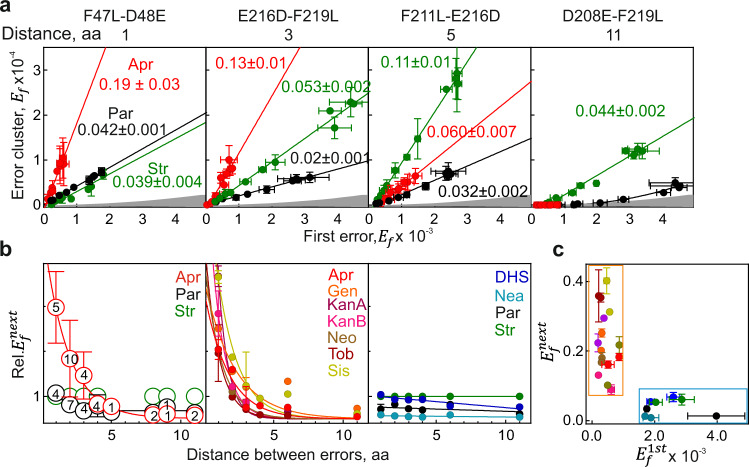
Fig. 5. Distance dependence of successive errors.
a Correlation between and for different AGAs and clusters. Slopes of the linear plots yield the values. Shown are means ± SD of three technical replicates (n = 3). Expected stochastic level of error clusters is indicated as gray area. b Distance dependence of error cluster formation. Left panel: Distance dependence for Apr, Par, and Str. Data from Figs. 4a, d, 5a, and Supplementary Figs. 7a, 8. The probability for error cluster formation is normalized to that of Str value, which has very little distance dependence and is set to 1 (‘Methods’). The number of clusters is indicated inside the symbols. When more than one cluster per distance was inspected, mean values ± SD are shown. Middle and right panel: Distance dependence of error cluster formation for different AGA based on PRM measurements. For single clusters, a mean of technical replicates is shown (n = 3). If two or more clusters were considered for a given distance, the symbols represent a mean ± SD. c Correlation between and for different AGAs. Data and color code are from (b). Only clusters with adjacent substitutions are considered (F47L-D48E; E241D-E242D). Shown are means ± SD of three technical replicates (n = 3). See also Fig. 4a, d, Supplementary Figs. 7, 8, and Source data file.

