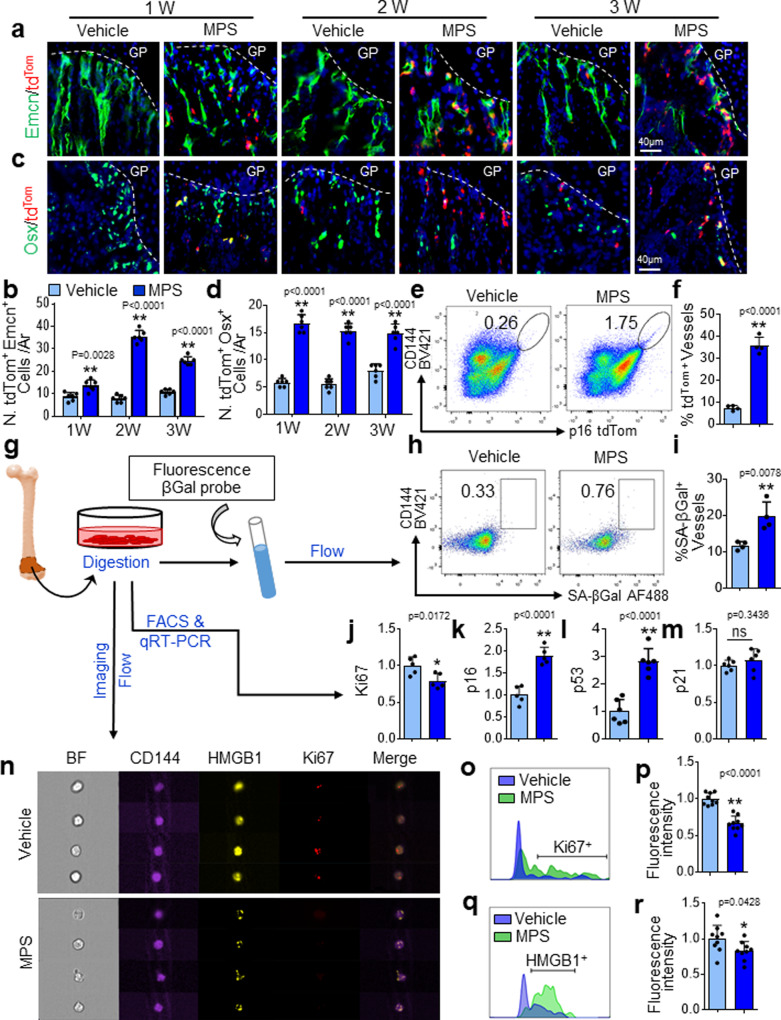
Fig. 2. Metaphyseal vascular cells and osteoprogenitors undergo senescence in response to GC treatment.
a–d Three-week-old p16tdTom mice were treated with MPS at 10 mg/m2/day or vehicle by daily intraperitoneal injection for 1–3 weeks. Immunofluorescence staining of femoral bone sections was performed using antibody against Endomucin (Emcn) and Osterix (Osx), respectively. Representative confocal images were shown in (a) and (c). Red: tdTom+ cells; Green: Emcn+ or Osx+ cells; Blue: nuclear staining by DAPI. Quantified numbers of Emcn and tdTom double-positive cells (N. tdTom+Emcn+ cells/Ar) and Osx and tdTomdouble-positive cells (N. tdTom+Osx+ cells/Ar) in primary spongiosa are shown in (b) and (d), respectively. e and f Three-week-old p16tdTom mice were treated with MPS or vehicle for 2 weeks. Bone cells were isolated from femoral metaphysis for flow cytometry analysis. Representative images are shown in (e). Percentages of tdTom-expressing cells in total CD144+ vascular cell population are shown in (f). g–i Three-week-old BALB/c mice were treated with MPS at 10 mg/m2/day or vehicle by daily intraperitoneal injection for 3 weeks. Schematic diagram showing the experimental procedure (g). Cells were isolated from femoral metaphyseal region, and the cell suspension was incubated with a fluorescence βGal probe and subjected to flow cytometry analysis. Representative images of the flow cytometry analysis are shown in (h). Percentage of SA-βGal-expressing CD144+ vascular endothelial cells is shown in (i). j–m The cell suspension prepared as described in (g) were subjected to FACS sorting followed by qRT-PCR analysis. mRNA levels of ki67 (j), p16 (k), p53 (l), and p21(m) are shown. n–r The cell suspension prepared as described in (g) were subjected to single-cell imaging flow analysis using ImageStreamX (see the detailed description in the “Methods” section). Representative images of the cells are shown in (n). Representative histogram presents max pixel intensity of Ki67 and HMGB1, respectively (o and q). Quantification of the fluorescence intensity of Ki67 and HMGB1 signals in CD144+ cells were shown in (p) and (r), respectively. GP growth plate. Ar tissue area. BF bright field. n = 4-6 mice. Data are represented as mean ± s.e.m. *p < 0.05, **p < 0.01, ns not significant, as determined by two-tailed Student’s t-tests.

