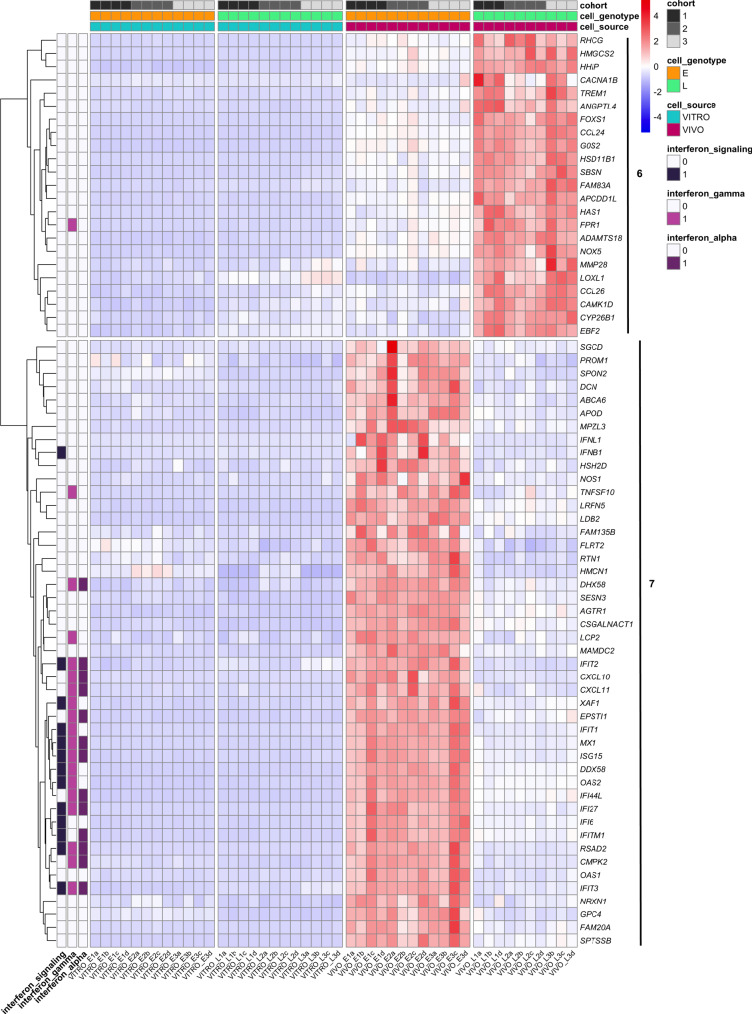
Fig. 4. In vitro and in vivo differentially expressed genes between A375 melanoma cells expressing LRRN4CL or empty vector.
Cluster 6 and 7 of the heatmap of the differentially expressed genes (DEGs) between A375 melanoma cells over-expressing LRRN4CL (L) and A375 cells transduced with the empty vector (E) that were growing in vitro (VITRO) or in the lungs of mice for 21 days (VIVO). Supplementary Figure 7 shows the full heatmap with all eight clusters. Three independent experiments were performed (cohorts 1–3) with four samples (a–d) per experiment per cell line (two samples are not shown on the heatmap as they were outliers on the PCA). Genes were scored as differentially expressed if they had a log2 fold change ≤ −1 or ≥+1 with a Padj < 0.01. Individual genes within gene set enrichment analysis (GSEA)-identified significantly down-regulated pathways are shown (‘interferon_signaling’, ‘interferon_gamma’, ‘interferon_alpha’).

