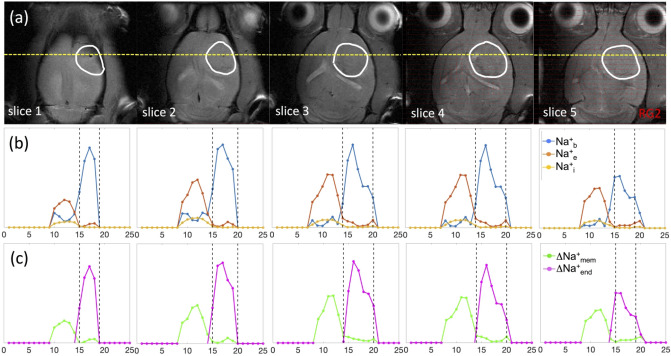
Figure 5.
Coronal projections of compartmentalized 23Na signals (Na+b, Na+e, Na+i) as well as transendothelial (ΔNa+end) and transmembrane (ΔNa+mem) gradients in an RG2 tumor. (a) Axial 1H-MRI indicating the tumor (white outline) across slices (same as Fig. 4), where the yellow line indicates the position for a coronal projection. (b) Spatially varying 23Na signals for Na+b, Na+e, and Na+i are shown with blue, orange, and yellow lines, respectively, where the vertical black lines indicate the tumor boundary. The Na+b signal (blue) is clearly elevated in the tumor, and most elevated in slices 1–4 (or superficially). Behavior of Na+b signal (blue) is inversely related to Na+e signal (orange), which is high outside the tumor and weaker inside the tumor. While intratumoral Na+b signal (blue) is high in slices 1–4, the peritumoral Na+e signal (orange) is highest in slices 3–4. Comparatively, the Na+i signal (yellow) does not vary significantly across slices, but slightly lower inside the tumor than outside the tumor. (c) Behaviors of ∆Na+mem (green) and ∆Na+end (magenta) signals closely mimic patterns of Na+e and Na+b signals, respectively, indicating that each of those Na+ compartments is the primary driver of the respective Na+ gradient. See Figure S5 for a similar example for a U87 tumor.

