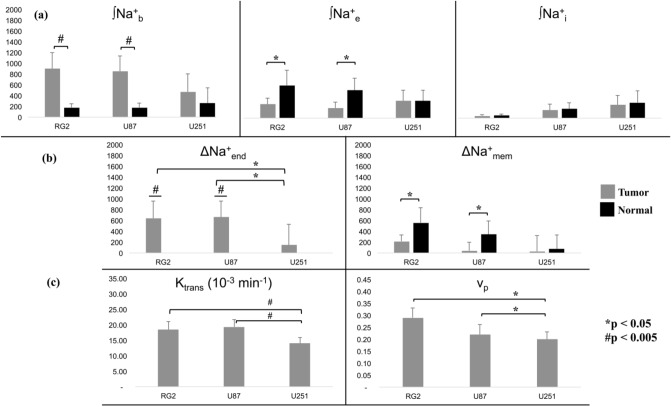
Figure 6.
Statistical comparisons between intracellular, extracellular, and vascular compartments across RG2, U87, and U251 tumors with 23Na-MRSI and 1H-DCE-MRI. (a) Relation between ∫Na+b, ∫Na+e and ∫Na+i across tumor and healthy tissues. For the RG2 and U87 tumors, the ∫Na+b values were significantly higher than normal tissue (p < 0.005, #). Also for these tumors, the ∫Na+e values were significantly lower than normal tissue (p < 0.05, *). The mean values for the U251 tumor roughly followed the same trend but were not significant. Furthermore, there was no significant difference between ∫Na+i values in tumor and normal tissues for any of the three tumor types. (b) Relations between tumor and normal tissues for ∆Na+end and ∆Na+mem for the three tumor types. Tumor ∆Na+end values were significantly larger than normal values (p < 0.005, #), which were non-positive (data not shown). Moreover, ∆Na+end in RG2 and U87 tumors was significantly greater than in the U251 tumor (p < 0.05, *), indicative of vascular differences between the tumor types. ∆Na+mem values were, on average, weaker in tumor compared to normal tissue, but significant only in RG2 and U87 tumors (p < 0.05, *). Based on Figs. 5 and S5, it is clear that the relation between ∆Na+end and ∆Na+mem is negative. (c) 1H-DCE-MRI data for the volume transfer coefficient (Ktrans) and plasma volume fraction (vp) values, which are known to reveal information regarding vascular structure and function. Ktrans follows the same patterns as ∫Na+b and ∆Na+end across tumor types. Ktrans (p < 0.005, #) and vp (p < 0.05, *) were both significantly larger in RG2 and U87 tumors, compared to U251. See Figure S6 for the plasma flow rate (Fp) and the extracellular volume fraction (ve) 1H-DCE-MRI parameters for each tumor type. See Figure S7 for exemplary maps of 1H-DCE-MRI parameters for individual animals from each tumor type.

