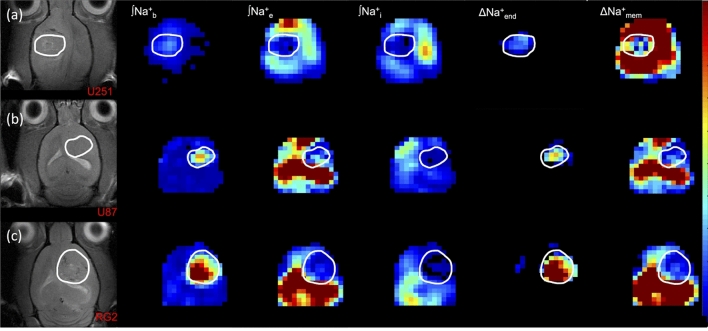
Figure 7.
Representative maps of compartmentalized 23Na signals (Na+b, Na+e, Na+i) as well as transendothelial (ΔNa+end) and transmembrane (ΔNa+mem) gradients in U251, U87, and RG2 tumors. The left column shows the tumor location (white outline) on the anatomical 1H-MRI for animals bearing (a) U251, (b) U87 and (c) RG2 tumors. The respective three columns show ∫Na+b, ∫Na+e, and ∫Na+i maps. The last two columns on the right show the ΔNa+end and ΔNa+mem maps. In all tumors the ∫Na+b and ∫Na+e are high and low, respectively, and thus are the main drivers for a high ΔNa+end and a low ΔNa+mem.

