Figure 4.
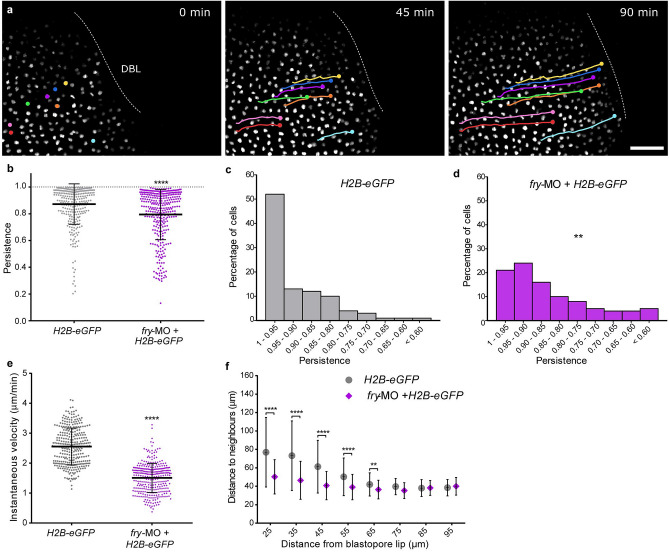
Fry depletion affects the motion of superficial involuting marginal zone cells. (a) Xenopus 4-cell stage embryos were dorsally injected with H2B-eGFP mRNA with or without fry-MO (15 ng) and mounted for light-sheet fluorescence microscopy at the beginning of gastrulation (St. 10). Time lapse movies were recorded during gastrulation and individual cells were tracked while moving toward the dorsal blastopore lip (DBL) (e.g. nuclei in color. Circles and lines indicate nuclei position and trajectory, respectively). H2B-eGFP mRNA (N = 5; total number of tracked cells = 319); H2B-eGFP mRNA + fry-MO injected embryos (N = 5; total number of tracked cells = 332). N: number of independent experiments. Representative images from time-lapse movies at selected time-points (t) are shown. Scale bar: 100 μm. (b) Individual cell persistence measurements were calculated as the ratio between the linear distance traveled by the cell and the total length of its path. Each point represents a single cell. Statistical significance was evaluated using two-tailed Mann Whitney U-test. ****p < 0.0001 indicates statistically significant differences between groups. The mean and standard deviation are indicated. (c) Histogram representing the percentage of cells from control embryos (H2B-eGFP) for the different persistence intervals. (d) Histogram representing the percentage of cells from fry-MO + H2B-eGFP embryos for the different persistence intervals. Statistical significance was evaluated using Chi-square test. **p < 0.001 indicates statistically significant differences were found between groups. (e) Individual cell instantaneous velocity measurement. The mean and standard deviation are indicated. Each point represents a single cell. Statistical significance was evaluated using two-tailed Mann Whitney U-test. ****p < 0.0001 indicates statistically significant differences between groups. (f) Average distance from each cell nucleus to the nearest neighbors for all cells within a certain distance region from the blastopore lip (region size = 30 μm; overlapping region size = 5 μm). Distance to neighbors was quantified from the 150 min time point onward (St. 11.5) of the movies shown in a. Number of cells in each window was always larger than 100 cells. Data in the graph is presented as means with standard deviation. Statistical significance was evaluated using Kruskal–Wallis test and Dunn's multiple comparisons test. ****p < 0.0001 and **p < 0.01 indicate statistically significant differences between groups.

