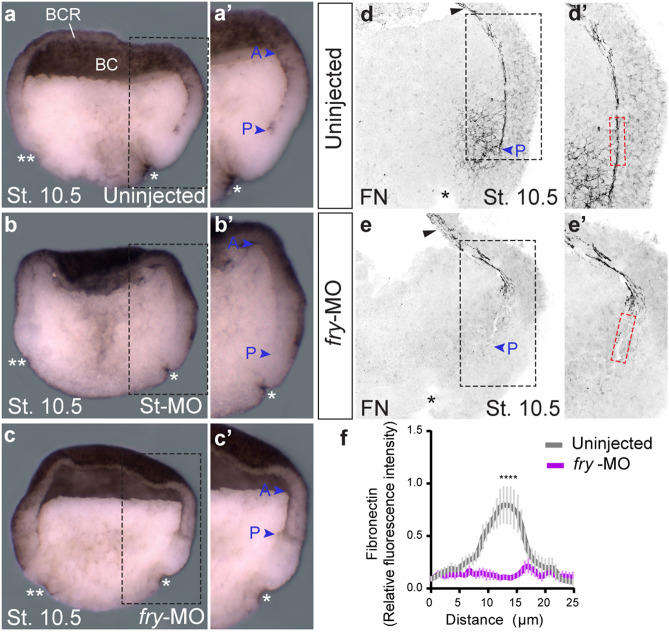
Figure 5.
The cleft of Brachet and fibronectin fibrillar matrix formation are affected in fry-depleted embryos. (a–c) Formation of the cleft of Brachet on the dorsal side was analyzed in hemisected early gastrula stage embryos (St. 10.5). (a) Uninjected embryo (N = 2, n = 26). (b) Standard Control morpholino (St-MO) (15 ng) injected embryo (N = 2; n = 13). (c) fry-MO (15 ng) injected embryo (N = 2; n = 25, in 92% of embryos, the cleft of Brachet is only present anteriorly). * indicates the position of the dorsal blastopore lip; ** indicates the ventral blastopore lip (morphological feature used as indication that embryos were developmentally synchronized at stage 10.5); blue arrowheads indicate the anterior (A) and posterior ends (P) of the cleft, BC: blastocoel; BCR: blastocoel roof. (a’–c’) Magnifications of the black-boxed area in panels a-c. Representative embryos are shown. (d,e) Hemisections of early gastrula stage embryos (St. 10.5) immunostained for fibronectin. (d) Uninjected embryo. (e) fry-MO (15 ng) injected embryo. Black arrowheads indicate fibronectin presence at the BCR. Blue arrowheads indicate the posterior end (P) of the cleft. (d’,e’) Magnifications of the black-boxed area in panels d and e. For fibronectin quantification, a rectangle 25 μm wide and 100 μm long was drawn at a distance of 300 μm from the dorsal blastopore lip (*) across the cleft of Brachet (red-boxed area). (f) Fibronectin abundance was quantified as fluorescence intensity across the 25 μm width of the red rectangle and normalized to the mean fluorescence (see Methods) in uninjected embryos (N = 2; n = 7) and fry-MO (15 ng) injected embryos (N = 2; n = 8). Data in the graph is presented as mean with standard error. Statistical significance was evaluated using two-tailed Mann Whitney U-test. **** p < 0.0001 indicates statistically significant differences between groups.

