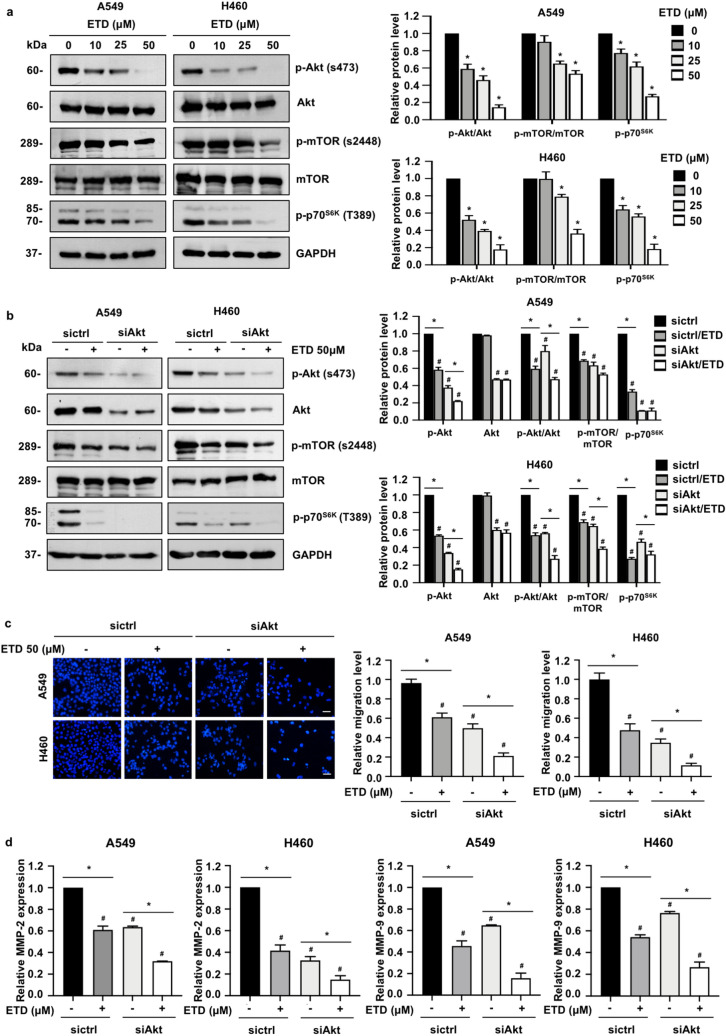
Figure 4.
ETD inhibits cell migration and invasion via an Akt/mTOR/p70S6K-dependent mechanism. (A) A549 and H460 cells were treated with nontoxic concentrations of ETD for 24 h. The protein expression levels of p-Akt, Akt, p-mTOR, mTOR and p-p70S6K were examined by Western blot analysis. The protein expression levels are displayed as the mean ± SEM (n = 3). *p < 0.05 vs untreated control group. (B) A549 and H460 cells were transfected with siRNA against Akt (siAkt) or si-mismatch control siRNA (siCtrl). After transfection for 18 h, cells were incubated with 50 µM ETD for 24 h and examined by Western blot analysis. The protein expression levels are shown as the mean ± SEM (n = 3). *p < 0.05 vs untreated cells, #p < 0.05 vs untreated siCtrl cells. (C) A549 and H460 cells were transfected with siRNA against Akt (siAkt) or si-mismatch control siRNA (siCtrl). After transfection for 48 h, cells were subjected to transwell migration assay in the presence or absence of 50 µM ETD. The scale bar is 10 µm. The data are shown as the mean ± SEM (n = 3). *p < 0.05 vs untreated cells, #p < 0.05 vs untreated siCtrl cells. (D) A549 and H460 cells were transfected with siRNA against Akt (siAkt) or si-mismatch control siRNA (siCtrl). After transfection for 18 h, cells were treated with 0–50 µM ETD for 48 h. MMP-2 and MMP-9 mRNA expressions were quantified by quantitative RT-PCR. The data are presented as the mean ± SEM (n = 3). *p < 0.05 vs untreated cells, #p < 0.05 vs untreated siCtrl cells.

