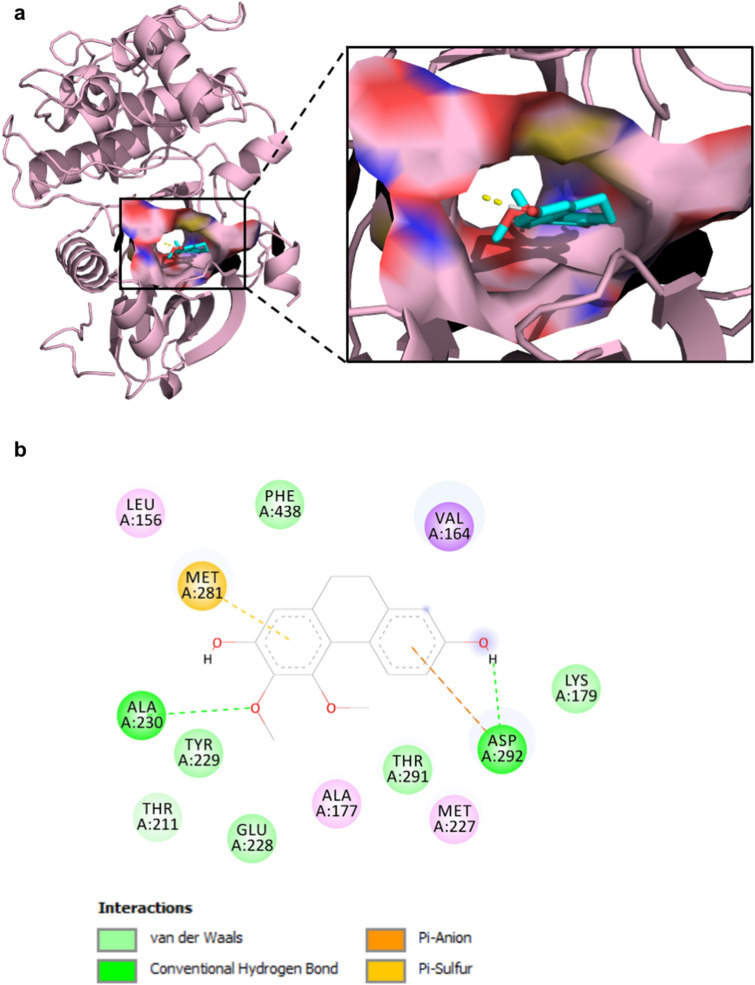
Figure 5.
ETD directly binds to Akt. (A) Molecular docking analysis of ETD and Akt was performed by AutoDock4.2 and PyMOL program. (B) A schematic diagram, created by BIOVIA Discovery Studio Visualizer 2017, of the interacting residues between ETD and Akt is shown. Hydrogen bonds are displayed in green. The van der Waals interactions are shown in light green. The anion-π and sulfur-π interactions are shown in orange and yellow, respectively.

