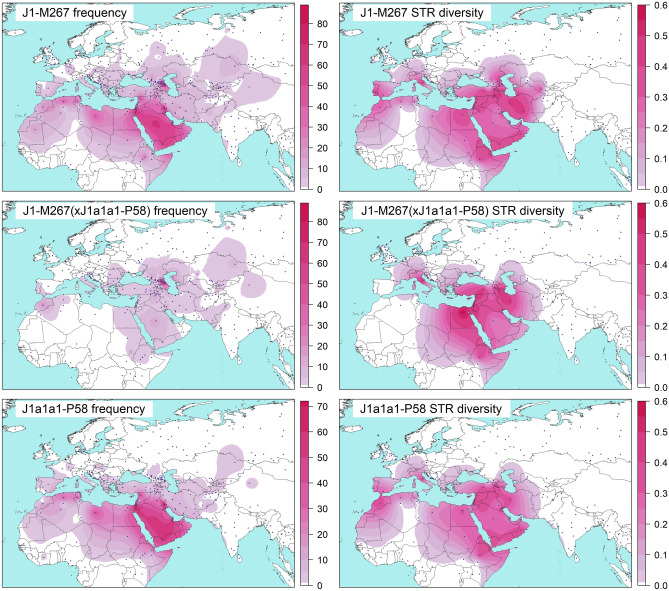
Figure 1.
Spatial frequency and diversity distribution maps. Datasets for the frequency plots differ. Please note the difference in the scales. Data from Supplementary Table S7 are used to generate the frequency maps. The diversities were calculated with 8 short tandem repeats (STR) reported in Supplementary Table S8. Blue filled circles mark sampling locations. Maps were generated in RStudio software v1.2.5019 based on R software v3.6.177,78. The base map was downloaded from http://tapiquen-sig.jimdo.com.

