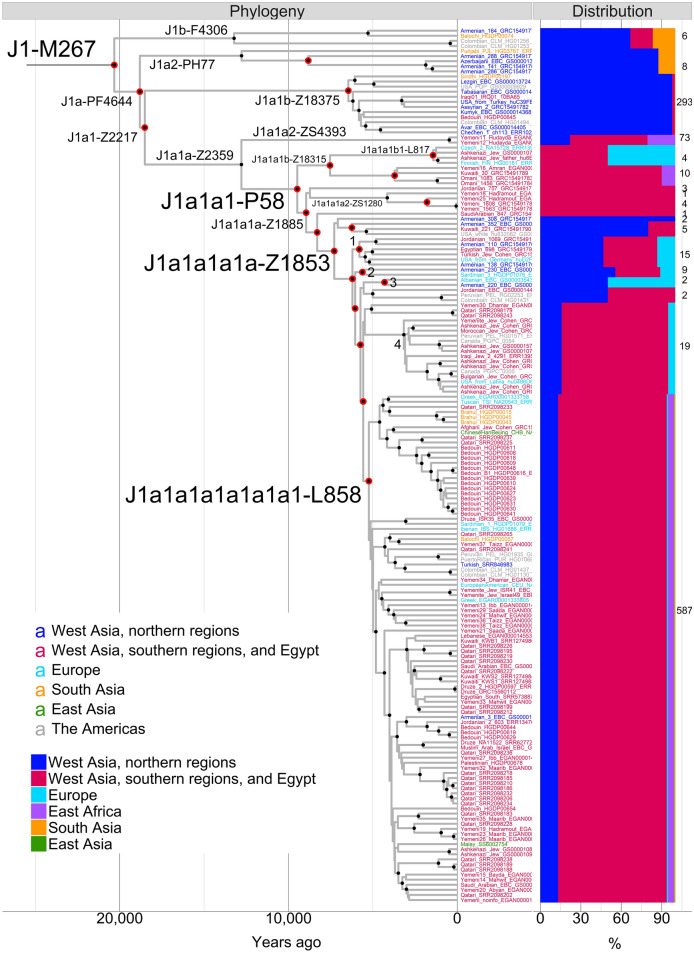
Figure 2.
Bayesian time-scaled maximum clade credibility tree of haplogroup J1-M267 and the distribution of the genotyped branches. The phylogeny is reconstructed with Beast v1.10.4 software82. Black filled circles mark the nodes with posterior probability ≥ 0.95. Red filled circles mark the nodes genotyped in the genotyping dataset. Tip labels are color coded according to geography. The frequencies of the branches are calculated out of 158 sequenced and 889 genotyped Eurasian and African samples belonging to that branch. The overall numbers are denoted at the rightmost side of the plot. The numbers written at the tree nodes refer to the following branches: 1—J1a1a1a1a1b-Z18297, 2—J1a1a1a1a1a2-ZS2524, 3—J1a1a1a1a1a1b-B2069, 4—J1a1a1a1a1a1a2-B877.

