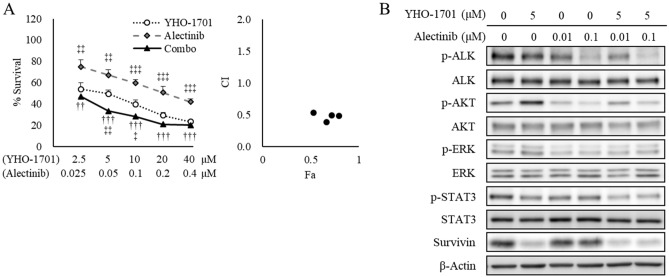
Figure 5.
Synergism between YHO-1701 and alectinib in H2228 cells. (A) The antiproliferative effect of YHO-1701 and/or alectinib was investigated at 72 h of exposure. Dose–response curves are represented in the left panel. Combination index (CI) values are plotted as a function of fraction affected (Fa) in the right panel. Significance was determined with Tukey’s test. ††p < 0.01; †††p < 0.001 versus the alectinib group. ‡p < 0.05; ‡‡p < 0.01; and ‡‡‡p < 0.001 versus the YHO-1701 group. (B) Phosphorylation/activation patterns of key molecules on ALK and STAT3 signaling pathways were examined by western blotting. H2228 cells were left untreated or treated with YHO-1701 and/or alectinib at the indicated doses for 24 h. The blots were probed with the respective primary antibodies. Cropped images are shown, and full-length blots are presented in Supplementary Fig. S3.

