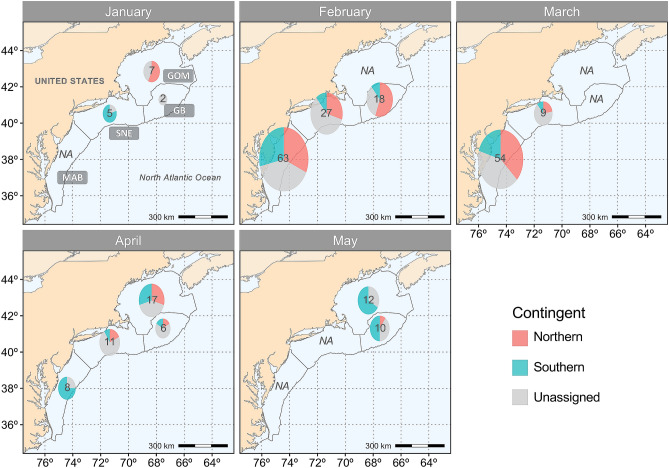
Figure 6.
Contingent composition of Northwest Atlantic mackerel age ≥ 2 adult samples by region at capture through January and May collected in 2013–2019. The four regions (MAB, SNE, GB, GOM) are shown in outlined boxes. Each pie chart indicates the number of samples collected within each region, and is proportional to the sample size. The map was created in R using the ggplot2 package version 3.3.2 URL: https://ggplot2.tidyverse.org73.

