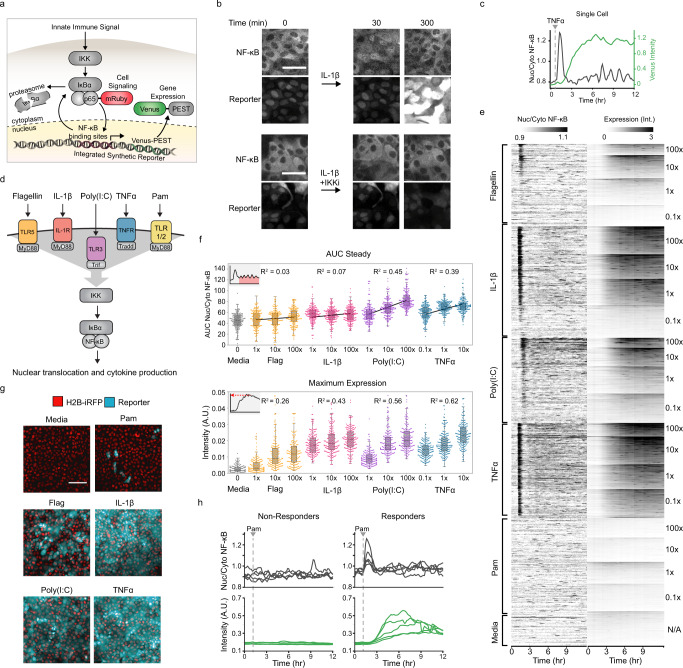
Fig. 1. MAMP sensing in epithelial monolayers shows digital and analog components.
a Schematic detailing the NF-κB-dependent gene expression reporter system. An innate immune signal activates IKK which phosphorylates IκBα and sends it for degradation, freeing the fluorescently tagged NF-κB subunit (p65-mRuby) to enter the nucleus and transcribe the Venus-PEST reporter. b MCF10A NF-κB reporter cells were incubated in the presence or absence of IL-1β (10 ng/ml) and/or IKK inhibitor VII (10 µM). Representative images from five replicates taken at indicated times are shown. Scale bar, 50 μm. c Representative single-cell trace. The median intensity of the nuclear/cytoplasmic NF-κB is plotted in black, while the median nuclear + cytoplasmic intensity gene expression reporter is in green. d Schematic of innate immune receptors and inputs that signal to NF-κB. TLR5, IL1R, and TLR1/2 all signal through MyD88. e Heatmap of all cells in the MAMP screen. MCF10A monoclonal reporter cell line was imaged for 50 min then treated with the indicated input and concentration. Concentrations at 100x were 1 µg/ml (Flagellin), 200 µg/ml (Poly(I:C)), 1 µg/ml (Pam3CSK4), 1 µg/ml (TNFα), and 100 ng/ml (IL-1β). Heatmaps are ordered top to bottom from highest to lowest maximum Venus expression. f (Top) Swarmplots of the area under the curve after the first NF-κB translocation peak (AUC steady) in 200 cells randomly sampled from the indicated input and concentration. (Bottom) Swarmplots of the 95th percentile of the gene expression in 200 cells randomly sampled from the indicated input and concentration. R squared values of the linear regression model fit to responses across the log of three concentrations. g Representative images of clonal MCF10A after 8 h of incubation with indicated stimulus (1 µg/ml (Flagellin), 100 ng/ml (IL-1β), 20 µg/ml (Poly(I:C)), 100 ng/ml (TNFα), and 1 µg/ml (Pam3CSK4)). H2B-iRFP nuclear marker is shown in red and Venus gene expression reporter is shown in cyan. Scale bar, 200 µm. h MCF10A NF-κB reporter cells stimulated with 1 µg/ml Pam3CSK4. Traces of NF-κB translocation (gray) and Venus expression (green) for five non-responders and responders are shown.

