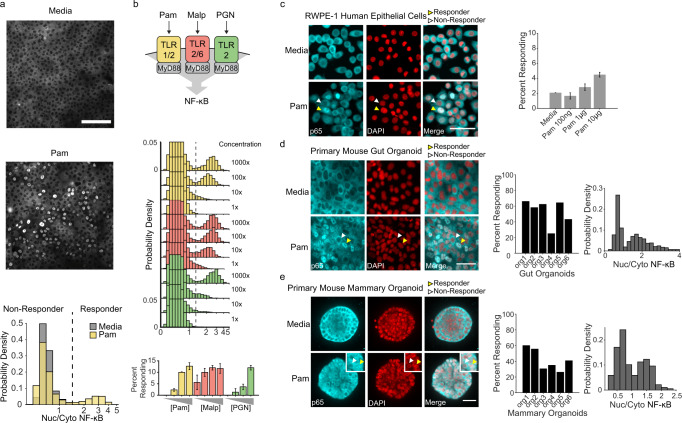
Fig. 2. Pam3CSK4 triggers a capped digital response in primary epithelial cells and organoids.
a p65 immunofluorescent stain of wild type MCF10A stimulated with media (top) or 1 µg/ml Pam3CSK4 (bottom) for 30 min. Scale bar, 300 µm. Histogram shows nuclear/cytoplasmic p65 intensity in logarithmic scale. Cells with nuclear/cytoplasmic p65 ratio greater than media controls were considered responders. b Dose-response curve of WT MCF10A with 30 minutes of Pam3CSK4 (0.01, 0.1, 1, 10 µg/ml), MALP (0.001, 0.01, 0.1, 1 µg/ml), or PGN (0.01, 0.1, 1, 10 µg/ml). Data represent the mean ± SD of three replicates. c Human prostate epithelial cells (RWPE-1) were cultured, treated for 30 mins with 10 µg/ml Pam3CSK4, fixed and stained as described in methods. Representative images are shown. Yellow and white arrows indicate examples of responder and non-responder cells respectively. Scale bar, 50 µm. Percent of cells in monolayer responding to increasing concentrations of Pam3CSK4. Data represent the mean ± SD of four replicates. d Primary mouse gut organoids were cultured as described in methods, treated for 30 mins with 10 µg/ml Pam3CSK4 and immunostained. Representative images are shown. Scale bar, 100 µm. Bar plot and histograms show quantification of percent responding cells in individual organoids and nuclear/cytoplasmic NF-κB amplitude of response in combined organoids. e Primary mouse mammary organoids were cultured as described in methods, treated for 30 mins with 10 µg/ml Pam3CSK4 and immunostained. Representative images of three independent replicates are shown. Scale bar, 30 µm. Bar plot and histograms show quantification as in panel d.

