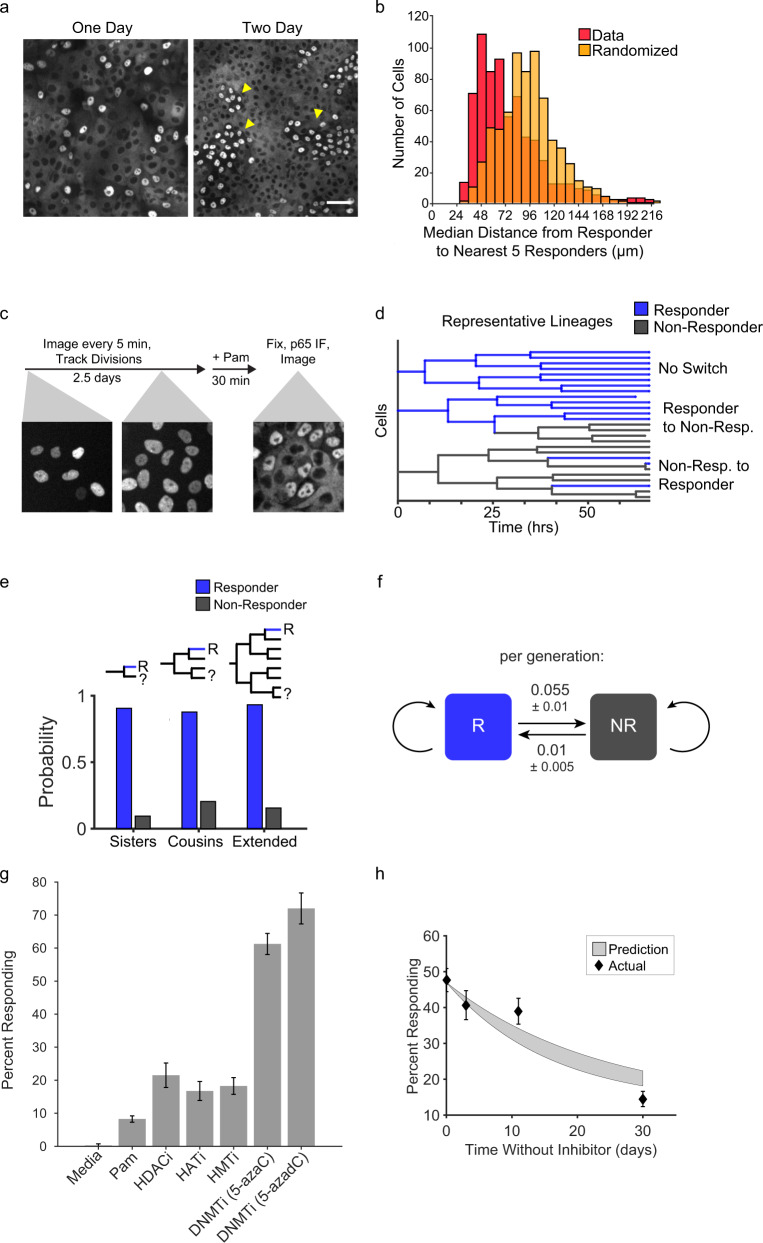
Fig. 3. Responder cell status is maintained over multiple generations via epigenetic mechanisms.
a WT MCF10A monolayers were grown for 24 (left) or 48 h (right), treated with 1 µg/ml Pam3CSK4, and immunostained for NF-κB. Arrows indicate clusters of responding cells. Scale bar, 100 µm. Images are representative of four replicates. b Monolayers were treated with 1 µg/ml Pam3CSK4 and immunostained for NF-κB response. Histograms show quantification of the median distance from each responder cell to the closest five responders in the monolayer versus randomized responder positions. c Schematic describing the workflow of the lineage-tracing experiment. Cell lineages were monitored for 60 h by tracking H2B-iRFP nuclear fluorescence. After the last time point cells were treated with 1 µg/ml Pam3CSK4, fixed and immunostained as described in Methods section. Responder status was measured in each terminal cell and the minimum number of status change events was assumed to reconstruct the lineage responder status. d Representative lineages obtained as described in panel c (Supplementary Fig. 5a). e Using data from lineage tracing the number of a responder cells having a sister, cousin, or extended relative cell that is a responder (blue) or non-responder (gray) was counted and the probability is reported. f Schematic to describe bistable switching rates obtained by model constructed from lineage tracing data. Responder and non-responder status is maintained with a low probability of switch per generation. See supplementary material for more information on the model. g WT MCF10A were cultured with epigenetic modifier inhibitors (HDACi (SAHA, 800 nM), HATi (A-485, 10 µM), HMTi (EPZ-6438, 5 µM), DNMTi (5-AzacytidineC, 500 nM, or 5-aza-2′-deoxycytidine (1 µM))) for 7 days prior to Pam3CSK4 treatment. Data represent the mean ± SD from four replicates. h Monolayers treated with 5-AzacytidineC as in panel g and cultured for 30 days from removal of the drug. At indicated times, the fraction of responder cells was measured as in Fig. 2a. Gray shading indicates the 95% confidence interval of the model prediction. Data represent the mean ± SD from three replicates.

