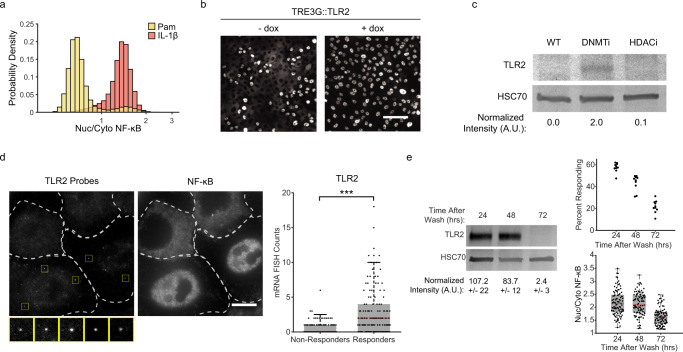
Fig. 4. Bimodal TLR2 expression limits the fraction of responder cells.
a Wild-type MCF10A were stimulated with 1 µg/ml Pam3CSK4 or 100 ng/ml IL-1β. Quantification of nuclear/cytoplasmic p65 immunofluorescent stain is shown in histograms on logarithmic scale. Data represents three replicates. b Cells were transduced with TLR2 under a Tet Responsive Element 3rd Generation (TRE3G) promoter and incubated with or without Doxycycline (2 µg/ml) for 24 h. Cells were then stimulated with 1 µg/ml Pam3CSK4 and immunostained to determine responder status as in Fig. 2a. Representative images of three replicates are shown. Scale bar, 100 µm. c Immunoblot against TLR2 in cells treated with or without DNMT inhibitor (5-AzacytidineC, 500 nM) or HDACi (SAHA 800 nM). HSC70 was used as a loading control. Data represents two replicates. d Dual smRNA FISH-immunofluorescence for TLR2 and NF-κB was done as described in Methods section. Dashed line indicates cell boundaries, yellow squares highlight the TLR2 probes. Representative images of two replicates are shown. Scale bar, 10 µm. Quantification of TLR2 mRNAs in responders and non-responders determined by NF-κB nuclear translocation. N = 354 cells total (148 Responder, 206 Non-Responder), p = 3.8e-19 by χ2 test with 9 degrees of freedom. e Western blot of TRE3G::TLR2 cells treated with a 4-h pulse of Doxycycline (2 µg/ml) and cultured for the indicated time. Relative amounts are normalized to HSC70 loading control. Standard deviation represents two independent experiments for each condition. Swarmplots represent technical replicates of the percentage of responding cells (top) and nucleus/cytoplasm NF-ĸB amplitude (bottom) in the same cells.

