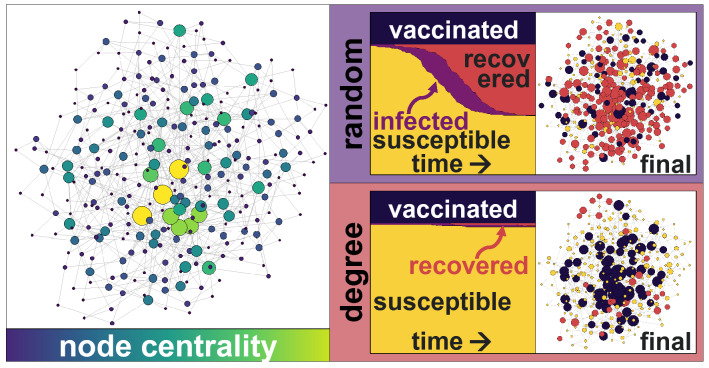
Figure 1.
Schematic representation of a scale-free network with power (left) with larger and brighter nodes displaying their node betweenness. The evolution of the SVIR model for the Random and Degree vaccination strategies (centre), with the same vaccination rate , shows that the majority of the population will remain susceptible under the targeted Degree vaccination strategy, but that a large part of the population will be infected and recovered under the Random strategy. The final state of the nodes (right) shows that many nodes are recovered (red) with a Random strategy, but most remain susceptible (yellow) with a Degree strategy.

