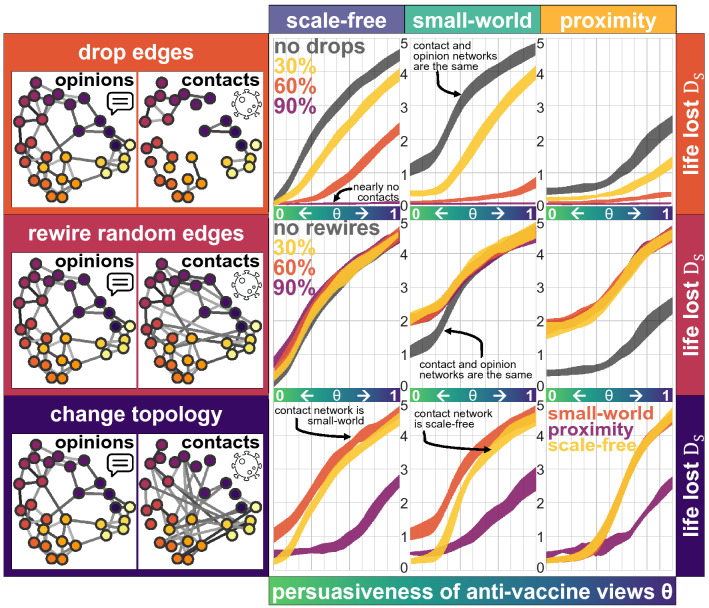
Figure 4.
Anti-vaccine views are shared on a network of individuals on a scale-free network (left), a small-world network (middle) and a proximity network (right), where some randomly-selected nodes initially are exposed to the views and share them according to the persuasiveness of the anti-vaccination views (horizontal axis). The contact network is constructed based on the opinion network by dropping edges (top panel), rewiring some edges (middle panel) or by changing the topology completely (bottom panel). The number of years of life lost at the end of the pandemic are measured, considering a vaccination rate of 30% and applying a Degree strategy, based on the degree of the contact network (vertical axis, ).

