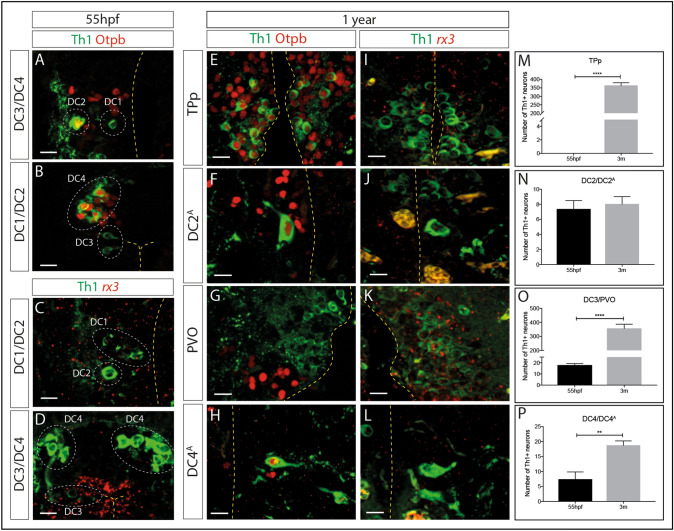
Figure 2.
Expression of Otp and rx3 in the embryonic and adult zebrafish posterior tuberculum (PT). (A-L) Immunohistochemical analysis for Th1 (green) and Otp (red) in representative transverse sections of 55hpf (A,B) or 12 month old (E–H) wild type zebrafish, or immunohistochemical analysis for Th1 (green) and rx3 (red) in transverse sections of 55hpf (C,D) or 12-month old (I–L) wild type zebrafish. Otp+Th1+ DA neurons are detected in DC2 (B) and DC4 (D) populations in the 55hpf embryo, whereas DA neurons in DC1 (A) and DC3 (C) populations are not Otp+. In the 12 month old zebrafish, Otp+Th1+ DA neurons are detected in the TPp (E), DC2A (F) and DC4A (H) populations but DA neurons in the PVO are not Otp+ (G). rx3+ is highly expressed in DC3 (D) neurons but barely detected in DC1, DC2 (C) or DC4 (D) neurons in the 55hpf embryo. In 12 month old zebrafish, rx3 is detected in PVO DA neurons (K) but barely detected in TPp (I), DC2A (J) or DC4A (L) DA neurons. Yellow dashed line marks the ventricle. Scale bars: 10 μm. (M–P) Quantitative analyses across entire populations show that the number of Th1+ DA neurons significantly increases between 55hpf and 3 months of age in the TPp (M) (t-test; p = < 0.0001, n = 3 fish each) (as described in the text, we propose TPp DA neurons are not equivalent to DC1 DA neurons, therefore at 55hpf we started the TPp DA quantification at zero), the PVO (N) (t-test; p = < 0.0001, n = 3 fish each) and the DC4 population (P) (t-test; p = 0.0026, n = 3 fish each). The number of DA neurons in the DC2 population does not significantly increase between 55hpf and 3 months (N) (t-test; p = 0.4918, n = 3 fish each).

