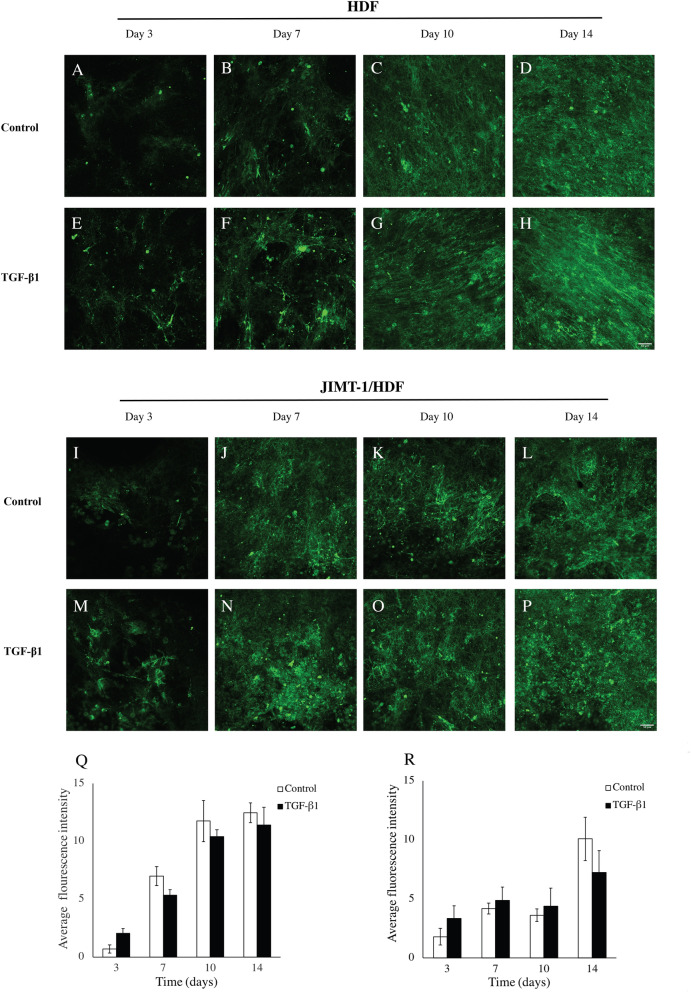
Figure 3.
Laminin deposition, localization, and quantification in decellularized scaffolds of HDF and JIMT-1/HDF 3D cultures. (A–P) Single confocal plane images of laminin deposition taken in the centre of decellularized 3D cultures incubated in the absence (control) or presence of 5 ng/ml TGF-β1. The 3D cultures were decellularized, fixed in 3.7% formaldehyde and stained to visualize fibronectin (green) at 3, 7, 10, and 1 days of culturing. All images are representative of 3 independent experiments. Scale bar is 50 μm. Quantification of fluorescence intensity using ImageJ in images taken by epifluorescence microscopy in HDF decellularized scaffolds (Q) and JIMT-1/HDF decellularized scaffolds (R). The columns are represented as mean ± SEM (n = 3).

