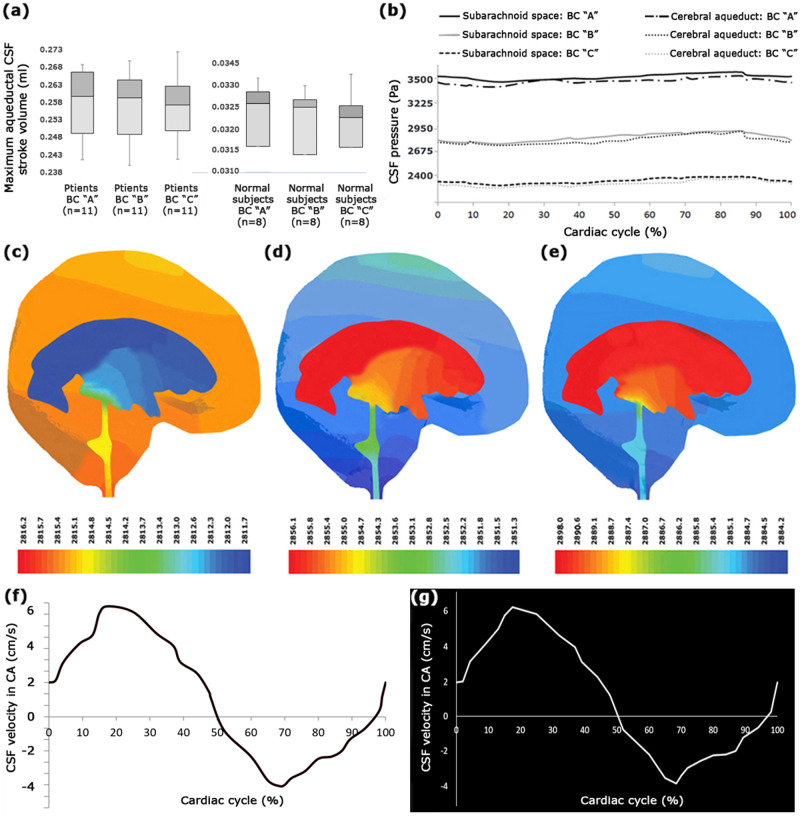
Fig. 1. Maximum aqueductal stroke volume, pressure, and velocity of CSF flow.
a The values of the maximum aqueductal CSF stroke volume for healthy subjects and patients under BCs “A”, “B”, and “C”. It should be noted that there were 8 healthy subjects and 11 hydrocephalus patients in this study. b compares the CSF pressure diagrams in the SAS and CA of patient No. 7 under BCs “A”, “B”, and “C”. c–e display three snapshots of CSF pressure distribution under BC “B” in the patient No. 7 at 17.5% (mid-systole), 64% (diastole), and 84% (early systole) of the cardiac cycle, respectively. The units of the color scale are Pascal. Panels (f) and (g), respectively, show the CSF velocity diagram calculated with FSI simulation and the in vivo-measured diagram based on the cardiac cycle under BC “C” in the CA of patient No. 7. Raw data for Fig. 1a are included in Supplementary Data 1. CV coefficient of variation, SE standard error, BC boundary condition, CSF cerebrospinal fluid, CA cerebral aqueduct.

