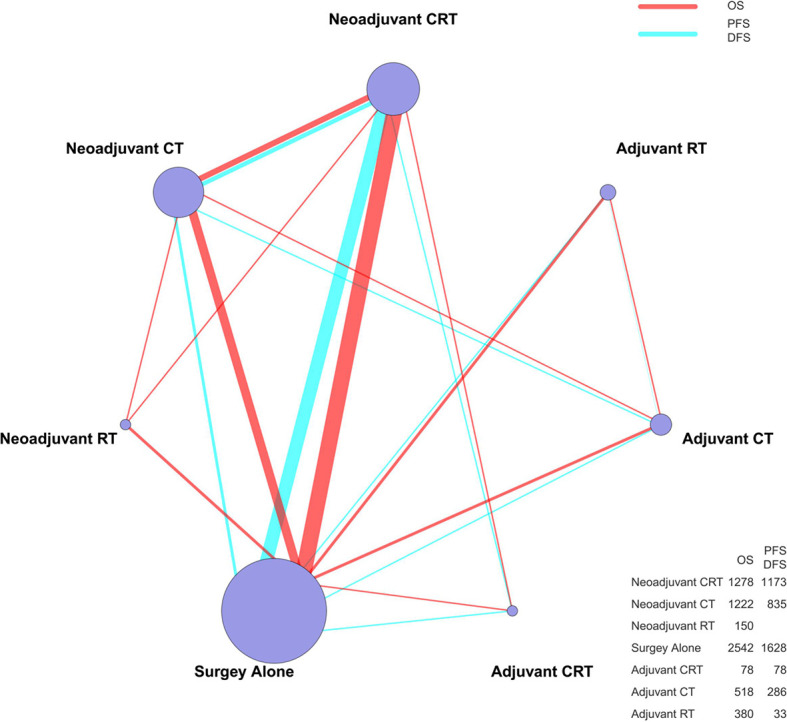
Figure 2.

The mixed treatment comparison framework of OS and PFS/DFS in patients with resectable esophageal cancer. The node size is proportional to the total number of patients receiving a specific treatment. Each line represents a type of head-to-head comparison. The width of lines is proportional to the number of trials comparing the connected treatments. CT, chemotherapy; RT, radiotherapy; CRT, chemoradiotherapy; OS, overall survival; PFS, progression-free survival; DFS, disease-free survival.
