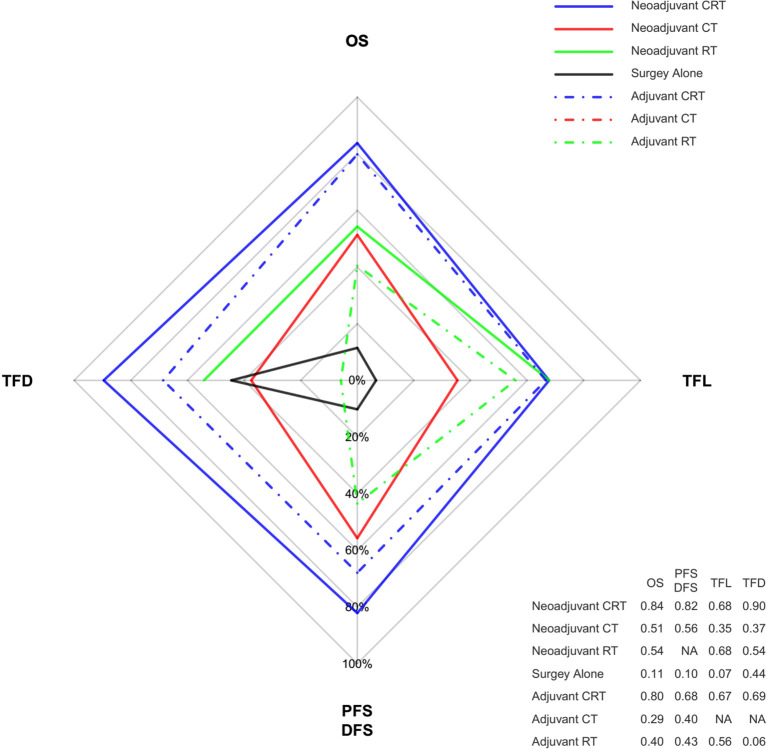
Figure 4.
Radar map of the Bayesian ranking results of 4 different endpoints. This map indicates the probability of each comparable treatment being ranked first in terms of different endpoints. Each vertex of the rhombus represents an endpoint, and each colored line represents a comparable treatment with the probability of being ranked first increasing from the inner to the outer rhombus. Neoadjuvant CRT had the greatest probability of being ranked first among these comparable treatments in terms of all the endpoints. The radar map is depicted according to the Bayesian ranking results based on SUCRA scores presented in supplement. CT, chemotherapy; RT, radiotherapy; CRT, chemoradiotherapy; OS, overall survival; PFS, progression-free survival; DFS, disease-free survival; TFD, reduction in treatment failure due to distant metastasis; TFL, reduction in treatment failure due to locoregional recurrence.

