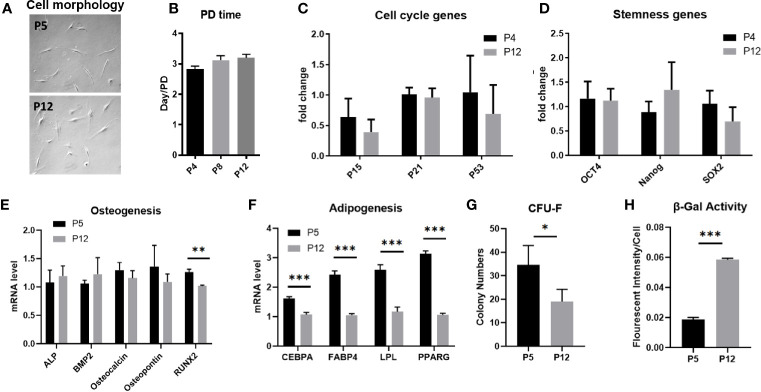
Figure 1.
Stem cell properties of hASCs during in vitro culture expansion. (A) Representative images of hASC morphology during culture expansion. Scale bar: 250 µm. (B) The population doubling time of hASCs at different passages. (C) mRNA levels of cell cycle markers of hASCs at different passages. mRNA levels of (D) stemness genes and genes for (E) osteogenic differentiation and (F) adipogenic differentiation of hASCs at different passages. (G) Colony-forming ability (CFU) and (H) β-gal activity of hASCs at P5 and P12. *indicates p < 0.05; **p < 0.01; ***p < 0.001.

