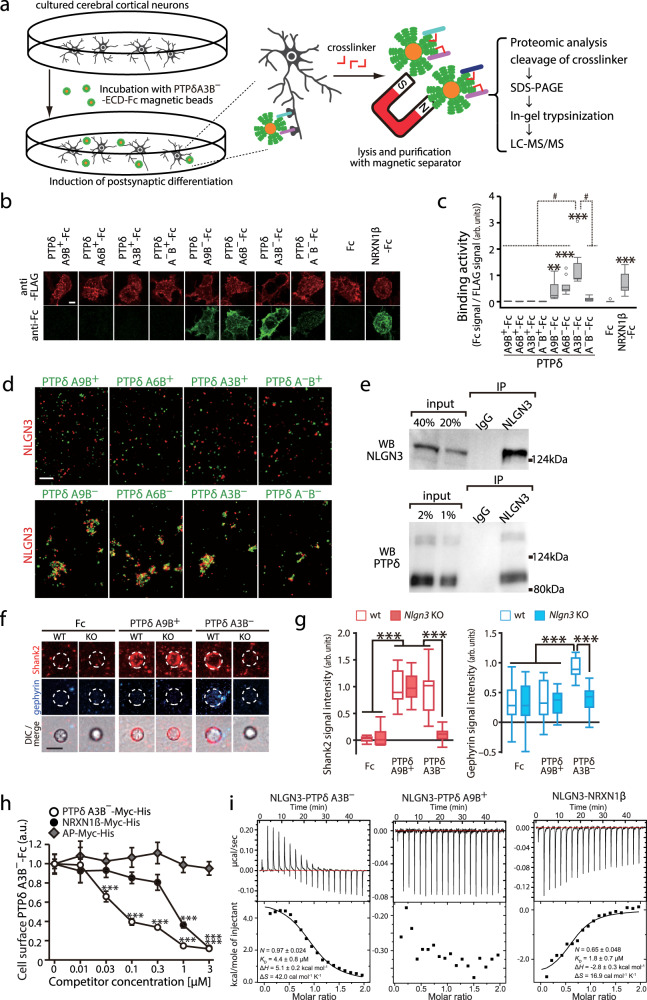
Fig. 2. Identification and characterization of non-canonical interactions between NLGN3 and PTPδ splice variants lacking meB.
a Schema for in situ screening of postsynaptic ligands for PTPδA3B– during hemi-synapse formation. b Cell surface binding of ECDs of PTPδ splice variants fused to Fc (green) to HEK293T cells expressing FLAG-NLGN3 (red). c Ratios of staining signals for Fc fusion proteins and FLAG-NLGN3 in (b) (n = 15 cells each). d Representative images of cell aggregation assay of HEK293T cells coexpressing NLGN3 and red fluorescent protein (red) and those coexpressing PTPδ splice variants and green fluorescent protein (green). The experiment was repeated independently twice or more. e Representative blots of coimmunoprecipitation (co-IP) assay of NLGN3 and PTPδ from mouse brain. The experiment was repeated independently twice. f PTPδA9B+ and PTPδA3B– bead-induced excitatory and inhibitory postsynaptic differentiation of wild-type (WT) and NLGN3 knockout (KO) cerebral cortical neurons visualized by Shank2 (red) and gephyrin (blue) immunostaining, respectively. g Intensity of staining signals for Shank2 and gephyrin on the PTPδA9B+ and PTPδA3B– beads in (f) (n = 17 and 12 Fc beads, 21 and 14 PTPδA9B+ beads, and 19 and 22 PTPδA3B– beads for wild-type and Nlgn3 KO neurons, respectively). h Competitive cell surface binding assay. Cell surface-bound PTPδA3B–-Fc signals in the presence of 0–3.0 μM alkaline phosphatase (AP)-Myc-His, PTPδA3B–-Myc-His or NRXN1β-Myc-His were quantified (n = 14 cells each). i ITC titration curves for binding of NLGN3 to PTPδ splicing variants and NRXN1β. Data in (c) and (g) are presented as box plots. The horizontal line in each box shows median, box shows the IQR and the whiskers are 1.5 × IQR. Data in (h) represent mean ± s.e.m. Scale bars, 5 μm. *p < 0.05, **p < 0.01, and ***p < 0.001, Tukey’s test in (g) and (h), and two-sided Dunnett’s test in (c) compared to Fc control. #p < 0.001, Tukey’s test compared to PTPδA3B–-Fc in (c). See Supplementary Table 4 for additional statistics and exact p values.

