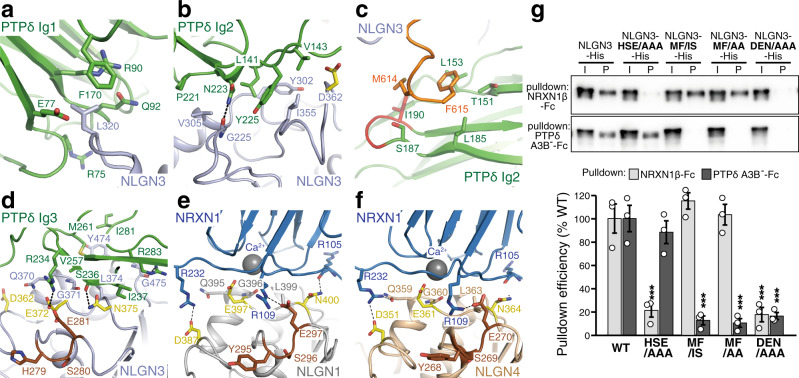
Fig. 4. Binding interfaces between NLGN3 and PTPδ.
a–c Close-up views of the NLGN3 α/β-hydrolase-fold core/PTPδ Ig1 interface (a), NLGN3 α/β-hydrolase-fold core/PTPδ Ig2 interface (b), and NLGN3 ECD C-terminal/PTPδ Ig2 interface (c). The coloring scheme is the same as that in Fig. 3b. d–f Close-up views of the NLGN3/PTPδ Ig3 interface (d), NLGN1/NRXN1β (PDB 3B3Q) interface (e), and NLGN4/NRXN1β (PDB 2WQZ) interface (f). The coloring scheme is the same as that in (a), except that (putative) NRXN/PTPδ-interacting residues (Asp362, Glu372, and Asn375) and NRXN-interacting loop (His279, Ser280, and Glu281) of NLGN3 are yellow and brown, respectively. The bound calcium ion is shown as a gray sphere. The NRXN-interacting residues of NLGN1 (Asp387, Glu397, and Asn400) and NLGN4 (Asp351, Glu361, and Asn364) are yellow. Tyr295, Ser296, and Glu297 of NLGN1, and Tyr268, Ser269, and Glu270 of NLGN4, which correspond to the NRXN-interacting loop of NLGN3, are brown. g NRXN1β or PTPδA3B– bound wild-type NLGN3, NLGN3-HSE/AAA, NLGN3-MF/IS, NLGN3-MF/AA, and NLGN3-DEN/AAA mutants with His6 tag were resolved by SDS-PAGE and blotted with anti-His antibody (top). The pulldown efficiency of wild-type or mutated NLGN3 was quantified (bottom; n = 3 experiments). Data are mean ± s.e.m. ***p < 0.001, Tukey’s test. See Supplementary Table 4 for exact p values.

